 Selario
Home › Meta spend by state vs Amazon sales
Meta spend vs Amazon sales by US state
If you run Meta ads nationally and ship Amazon orders to every state, a single US total can hide a mismatch. Selario places Meta’s own state-level ad numbers next to Amazon.com sales by ship-to state.
✓ Free to start, no credit card required. Free while in early access.
Screenshots show sample data for a fictional demo brand (Harbor Home), not a customer’s store.
What the table shows
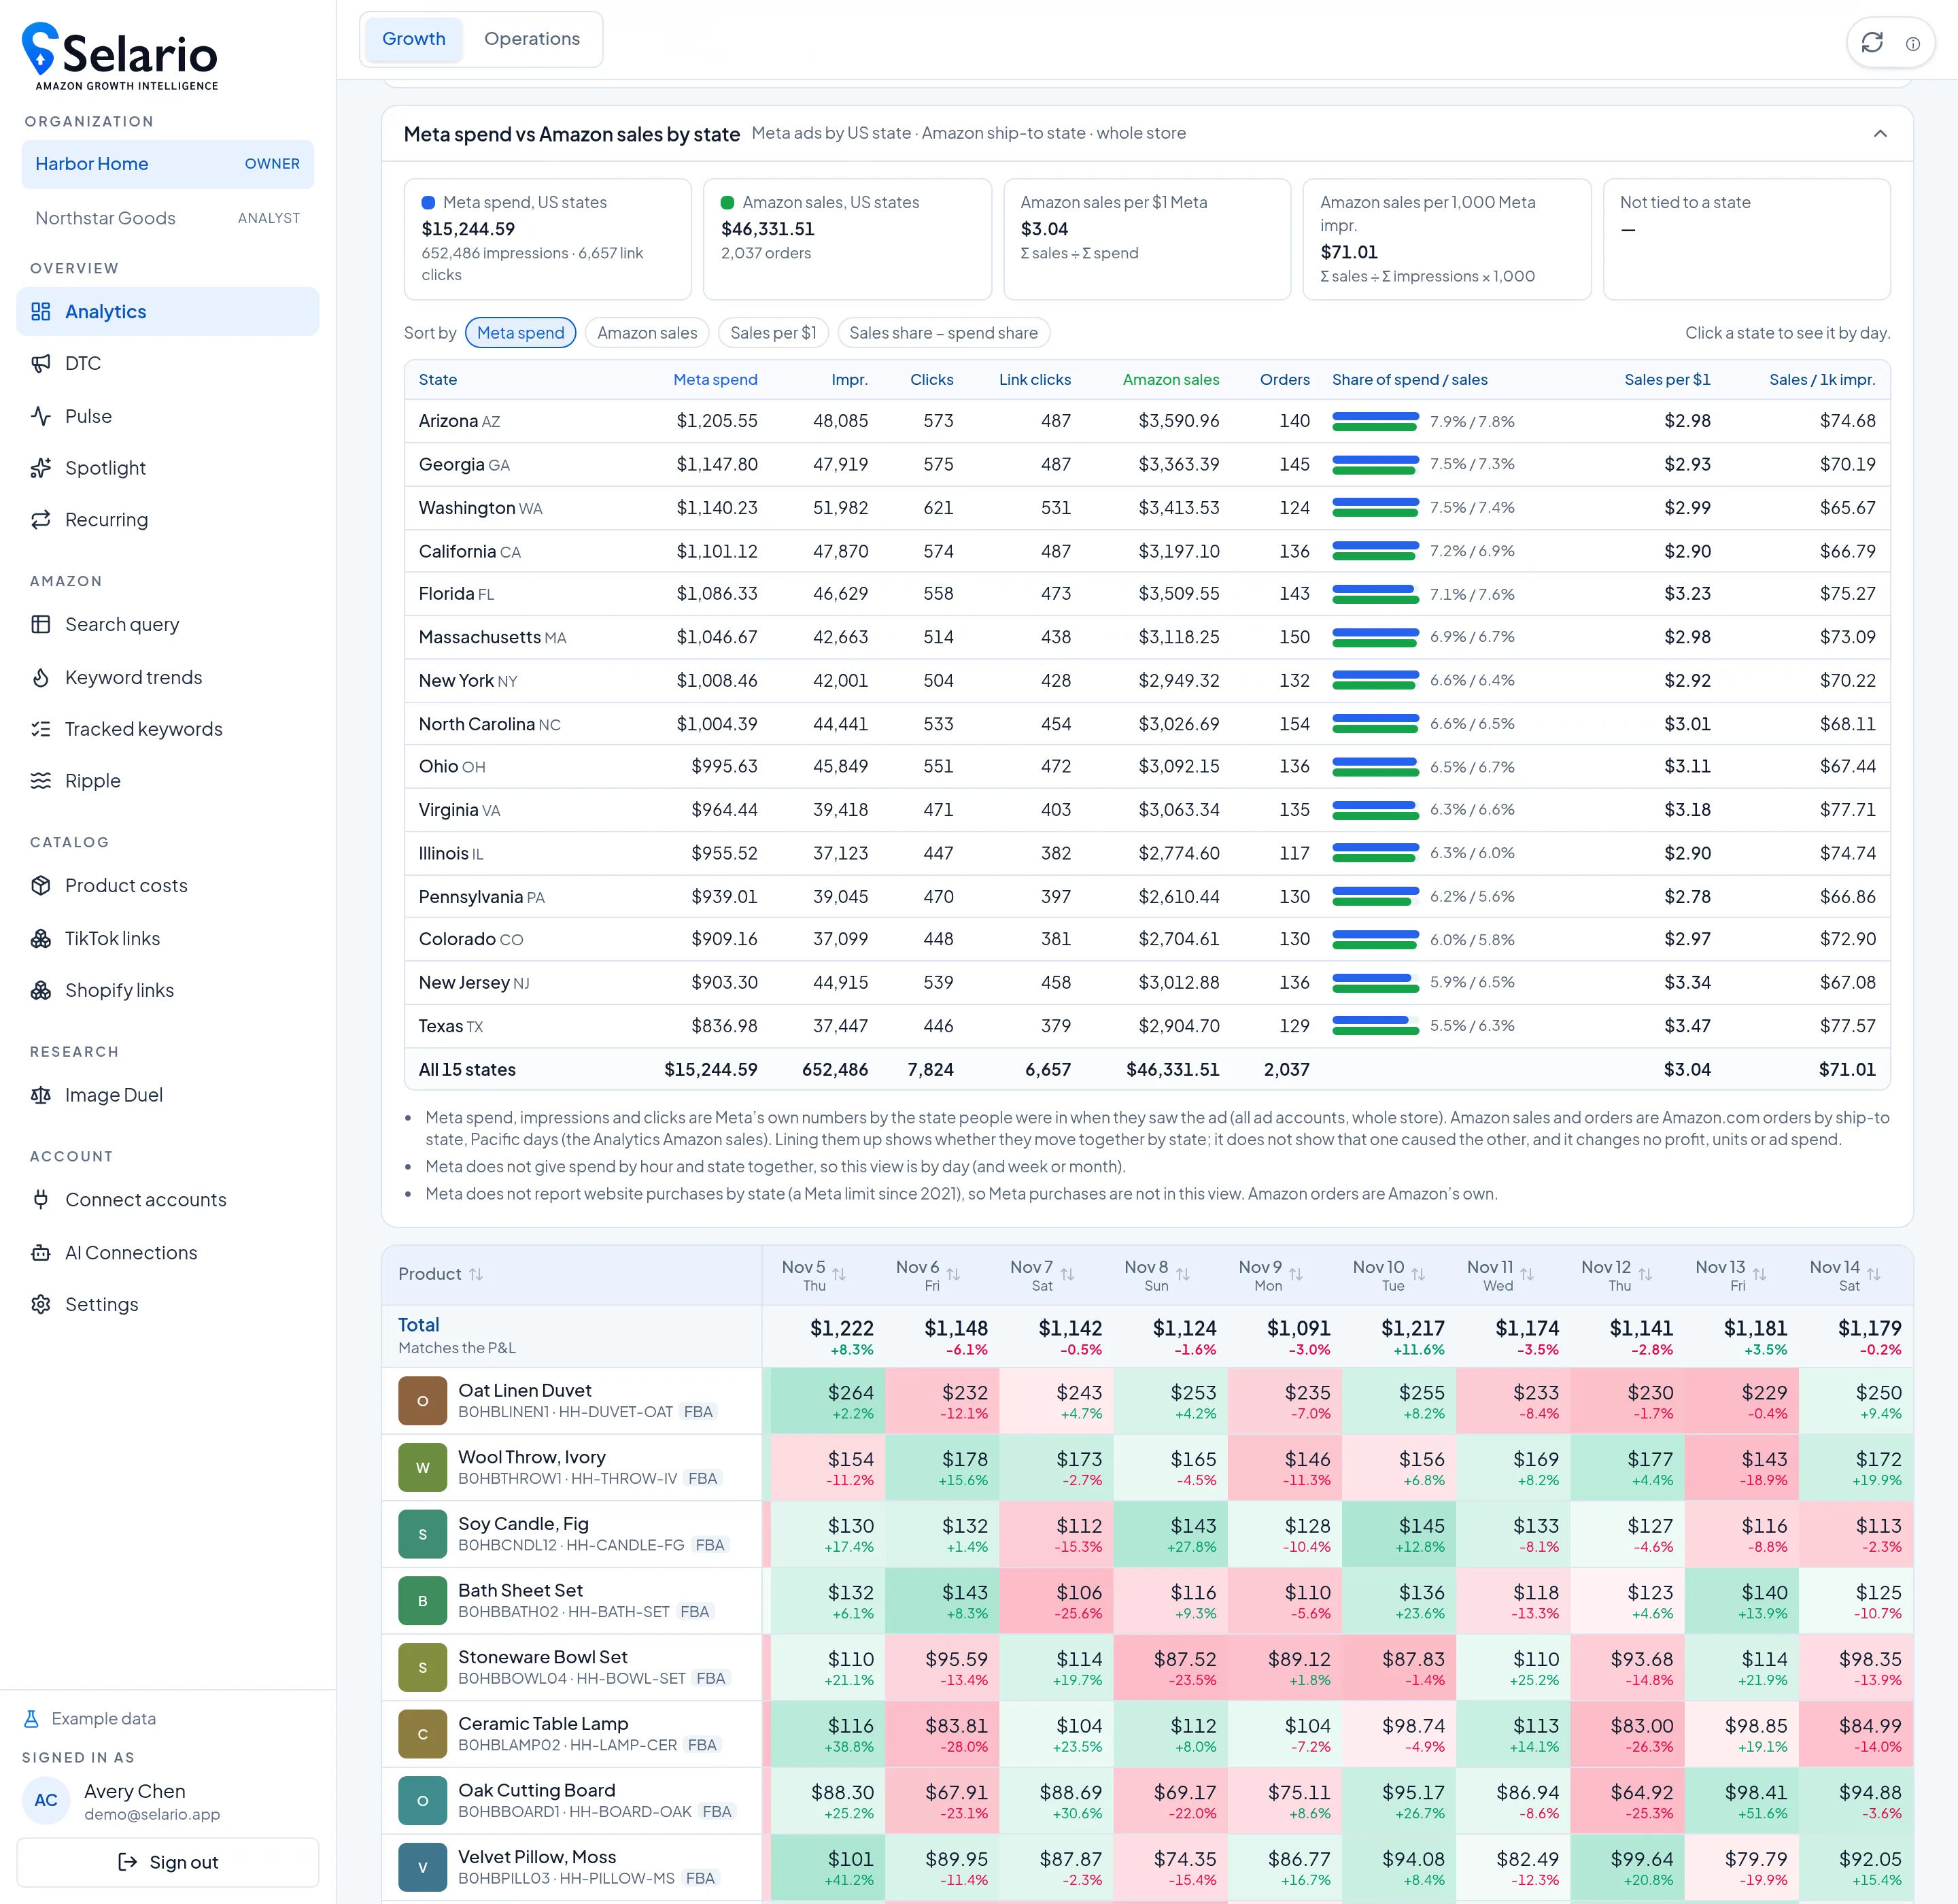
On Analytics → Trends, Meta spend vs Amazon sales by state lists US states with Meta spend, impressions, clicks and link clicks (Meta’s own numbers, by the state people were in when they saw the ad) next to Amazon.com sales and orders by ship-to state, for the same date range. You can sort by Meta spend, Amazon sales, sales per $1 of Meta spend, or sales share versus spend share. Click a state to see the comparison by day.
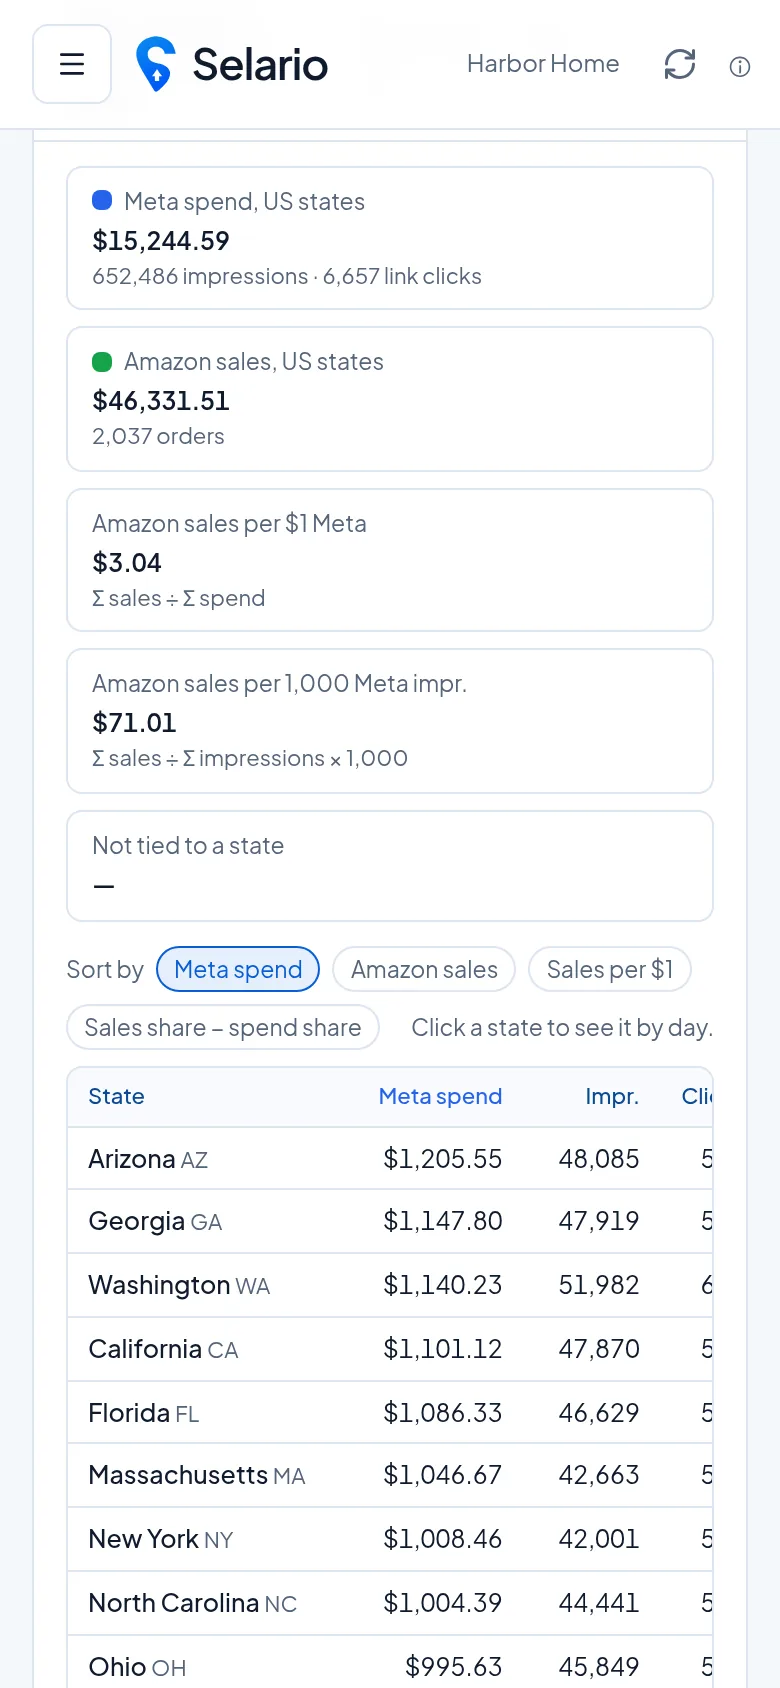
Summary cards show Meta spend across US states, Amazon sales across those states, Amazon sales per $1 of Meta spend, and Amazon sales per 1,000 Meta impressions. A “not tied to a state” card appears when some Amazon sales have no ship-to state in the data.
Important limits — read these first
- This is not attribution. The table shows whether spend and Amazon shipments line up by state. It does not show that the ads caused those orders, and it does not change profit, units or ad spend.
- Daily, not hourly, by state. Meta does not provide this breakdown by hour and state together, so Selario shows it by day (or by week or month if you set that grain). There is no invented hour-by-state split.
- No Meta website purchases by state. Meta does not report website purchases by state in the feed this view uses (a Meta limit since 2021), so those purchases are not in the table. Amazon orders are Amazon.com orders by ship-to state, on Pacific days, matching the Analytics Amazon sales.
- Whole-store Meta, Amazon.com shipments. Meta figures are all ad accounts, whole store, by the state of the person who saw the ad. Amazon figures are Amazon.com ship-to state.
How to open it
Go to Analytics → Trends and scroll to Meta spend vs Amazon sales by state. Sort the table, then click a state for a day-by-day comparison. The screenshot shows sample Harbor Home figures for 15 US states — made-up numbers, not a real advertiser.
How to use it
Look for states where Meta spend is a large share but Amazon sales are not, or the reverse. That can prompt a creative, audience or inventory question — not an automatic bid change. Pair it with the daily impressions vs Amazon sales chart and, on Shopify, with profit by ad.
How the state rows are built
Each row is one US state or district that appears in the Meta or Amazon data for the range. Meta spend, impressions, clicks and link clicks come from Meta’s breakdown by the state of the person who saw the ad, across the ad accounts in the view, for the whole store. Amazon sales and orders are Amazon.com orders whose ship-to address is in that state, on Pacific days, matching the Amazon sales you see on Dashboard and Trends. States with no Meta spend and no Amazon shipments simply do not appear.
The “share of spend / sales” bars are there to make a mismatch visible: a state can be a large share of Meta spend and a smaller share of Amazon shipments, or the reverse. Sales per $1 of Meta spend and sales per 1,000 Meta impressions are ratios of those two series, not an attributed ROAS. Because Meta does not provide website purchases by state in this feed, those ratios use Amazon ship-to sales, not Meta’s purchase value.
Why the grain is daily
Sellers sometimes want an hourly map. Meta does not give hour and state together for this comparison, and Selario will not invent that split. If you set Trends to week or month, the state table follows that grain. The day-by-day drill on a selected state is the place to see whether a gap showed up on a few dates or ran through the range. Pair this with the national impressions vs Amazon sales chart before you change budgets.
Related: Meta ads vs Amazon sales · Amazon, Shopify and TikTok profit · Shopify and Amazon analytics.
Frequently asked questions
Does this prove Meta ads caused Amazon sales in a state?
No. It compares Meta’s state-level ad numbers with Amazon.com sales shipped to that state. Alignment is a clue, not proof of cause.
Why isn’t this hourly by state?
Meta does not provide hour and state together for this view. Selario shows the comparison by day, or by the week or month grain you select, and does not invent an hourly state split.
Why are Meta purchases missing from the state table?
Meta does not report website purchases by state in the data this view uses, so Selario does not show them there. Amazon sales in the table are ship-to-state Amazon.com orders.
Is Selario free?
Dashboards are free during early access, with no credit card required.