 Selario
Home › Amazon keyword trends & SQP
Amazon keyword trends, rank tracking and Search Query Performance
Know what Amazon shoppers search for, where you rank, and which queries lead to your products — from Brand Analytics, with up to two years of daily and weekly search-term history on a fast dashboard. Built for product research, product development and spotting trends early.
✓ Free to start, no credit card required. Free while in early access.
Amazon search term trends, from Brand Analytics
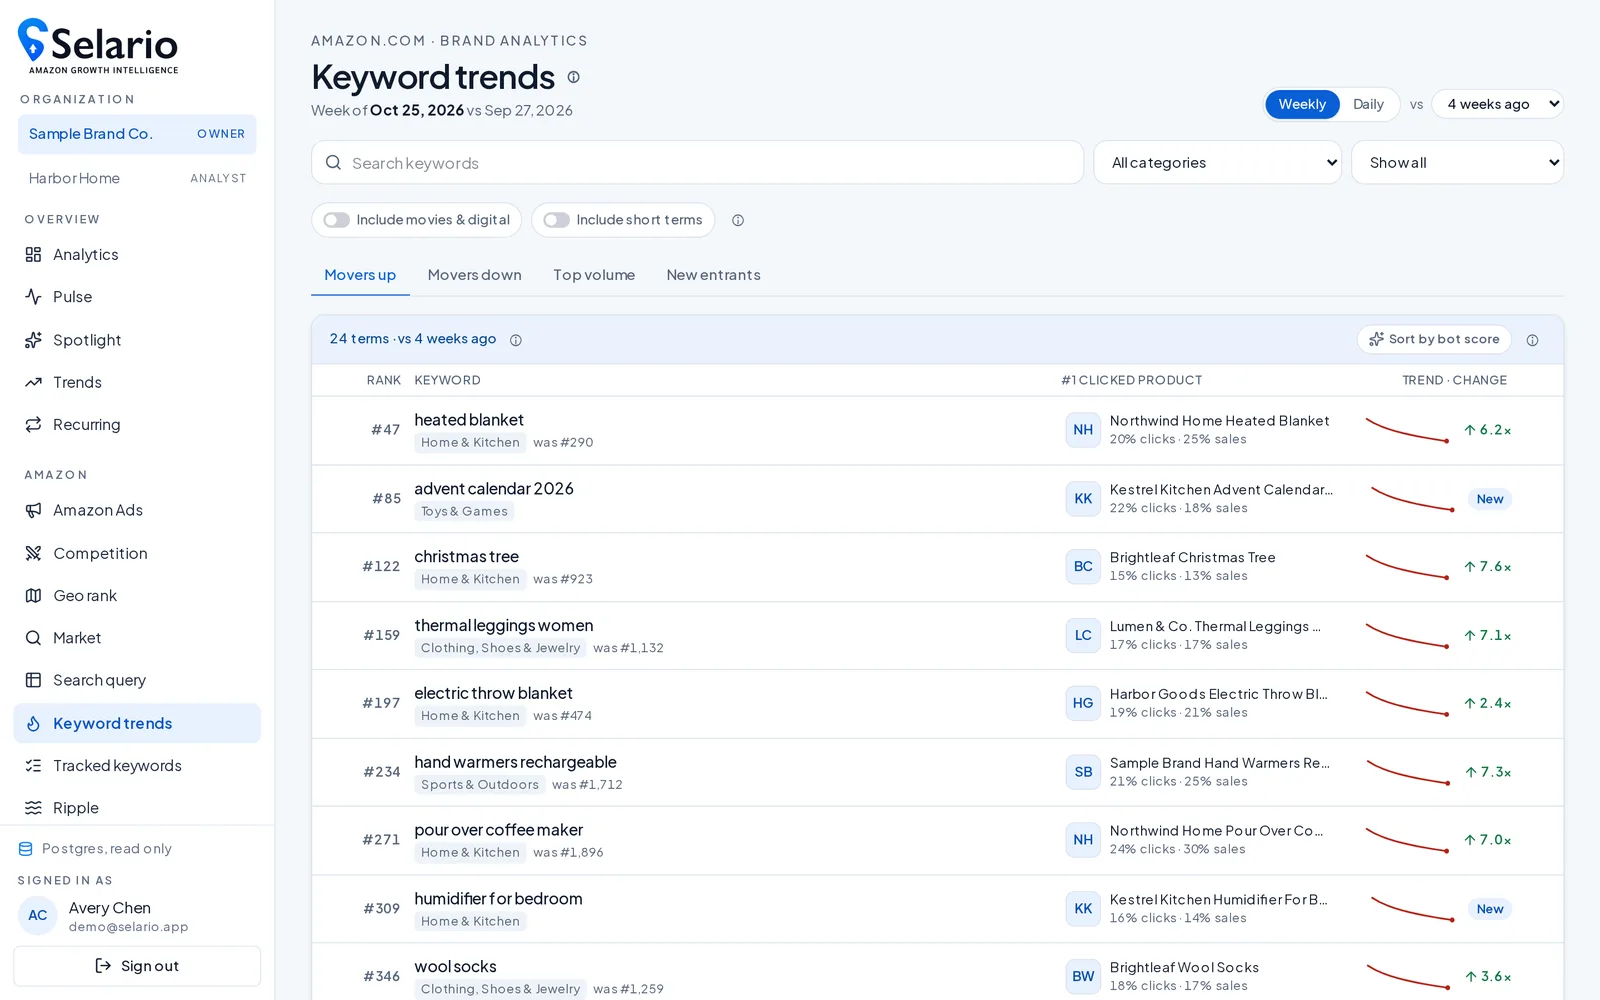
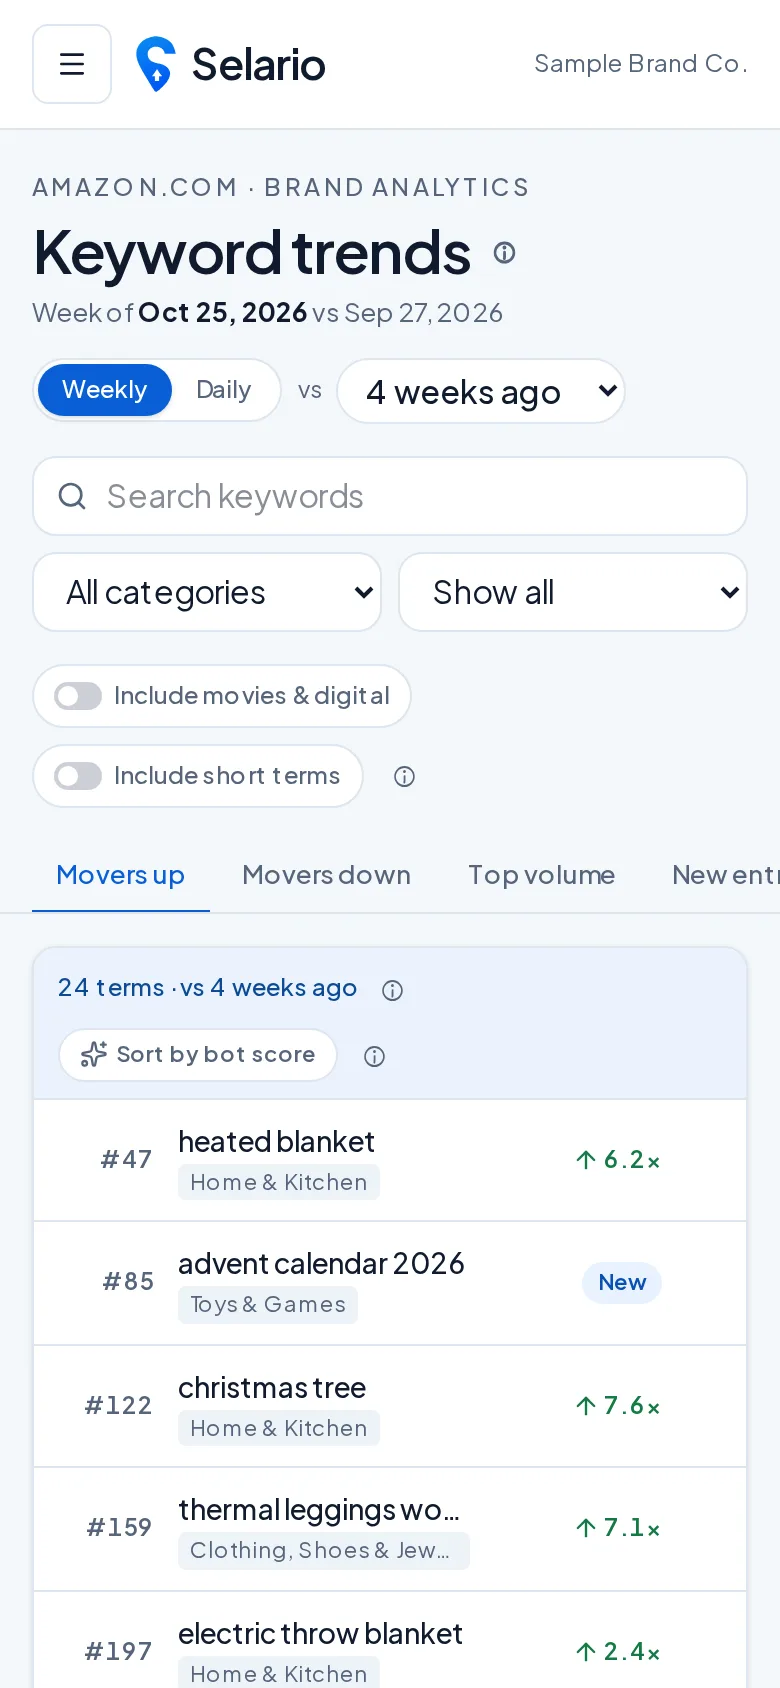
Keyword Trends is a leaderboard of the top 100,000 Amazon search terms, ranked by how often shoppers search them (search frequency rank, where #1 is the most searched term on Amazon.com). The data comes from Amazon Brand Analytics’ Search Terms report. It covers what all Amazon shoppers search for, not only searches that reach your own products.
Four views: movers up, movers down, top volume, new entrants
- Movers up: terms whose search rank improved the most, in proportion, versus the comparison period. These are rising searches you can catch early.
- Movers down: terms losing search interest, useful for spotting fading fads before you reorder inventory.
- Top volume: the most-searched terms right now.
- New entrants: terms that made the top 100,000 but were not in it, or not ranked at all, in the comparison period. These are often the first sign of a new product type, trend or viral item.
Day over day and week over week
Switch between daily and weekly data. Daily compares with 1, 7 or 28 days earlier; weekly compares with 1, 4 or 12 weeks earlier. Daily shows short spikes, such as a TikTok video or a news moment, and weekly smooths out the noise so you can see real trends. Use the Chart / Table toggle to see trends as a clean line chart or as a sortable table of the numbers.
Up to two years of history on a fast dashboard
Open any term to see its rank history. Daily ranges are 7 days, 30 days, 90 days, 180 days or 1 year, and weekly ranges go from 12 weeks up to 2 years (12, 26, 52 or 104 weeks). Results are pre-computed and cached, so the leaderboard loads quickly even across 100,000 terms. Your view (daily or weekly, comparison window, tab, categories, bot filter and sort) is saved per user.
Top clicked products, click share and purchase share
Each term shows the products shoppers click most after searching it. For the top three, a chart shows click share (solid line) and conversion (purchase) share (dashed line) over time, from 0 to 100%. This tells you who owns a search, whether clicks turn into sales, and when a new product starts taking share.
Likely bot-traffic flags
Some fast-rising terms are not real demand. Selario flags a likely bot spike when a term climbs sharply but shoppers are not buying: the top product (or the top three) gets a large share of clicks but a small share of purchases. Flagged terms get a score and reasons, and you can filter or sort by bot score. It is a hint, not proof, because a big product launch can look similar for a week or two. Digital categories such as streaming video, e-books, music and apps, plus very short autocomplete terms, are hidden by default, and you can include them with a toggle.
Categories and search
Filter by one or more categories, or search for any keyword. Amazon’s report has no categories, so Selario assigns each term the category of its top clicked products, weighted by click share.
Product development and new product ideas
- Open New entrants and Movers up on the weekly view, filtered to your categories.
- Skip terms flagged as likely bots.
- Open a term’s two-year history. Check it is a steady climb rather than a one-week spike, and whether it repeats every year (seasonal).
- Look at the top clicked products. If click share and purchase share are spread out, no one product owns the search, which can be an opening. If one product has most of both, it will be harder to win.
- Check related terms with the search box to size the whole niche, then validate with your own SQP data once you launch.
Use cases
- Product developers: find rising product types and features early, check that demand is durable and not a fad, and see which incumbents dominate.
- Brands: watch your category for new searches, track whether your branded terms are rising, see competitors gaining click and purchase share, and time launches and promotions to seasonal peaks.
- Sellers and PPC managers: find new keywords to target in Amazon ads and listings before competitors bid them up, and drop terms that are fading.
- TikTok Shop sellers: see daily whether a viral TikTok product is turning into Amazon searches, alongside the TikTok halo dashboard.
Search Query Performance (SQP)
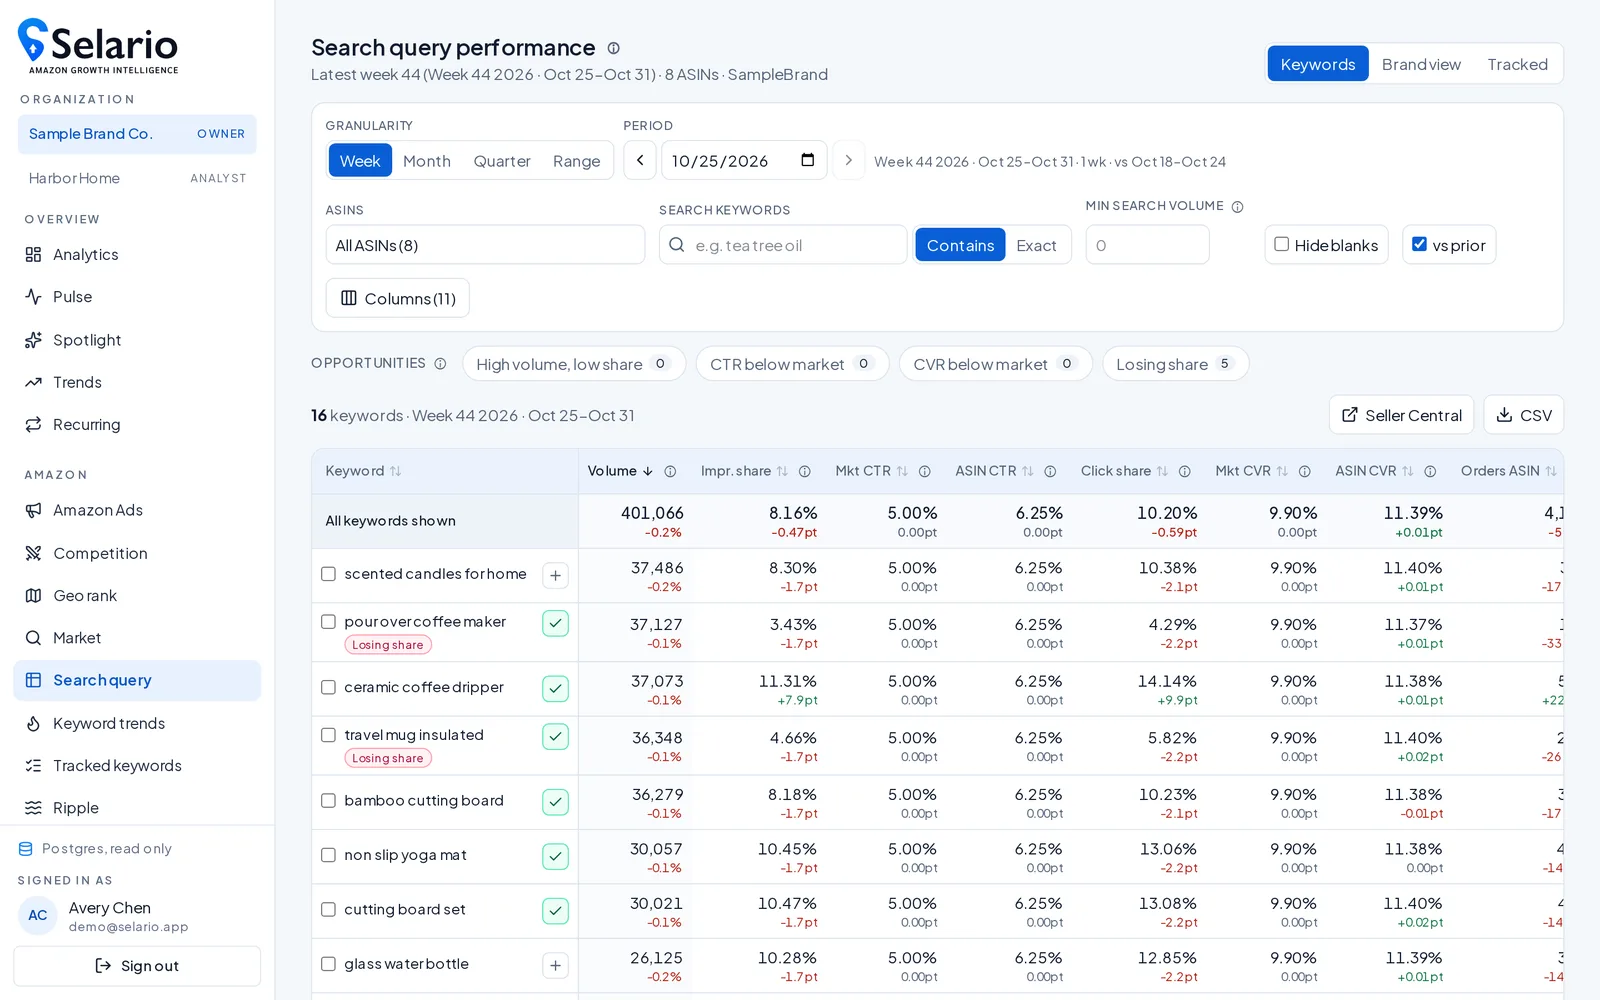
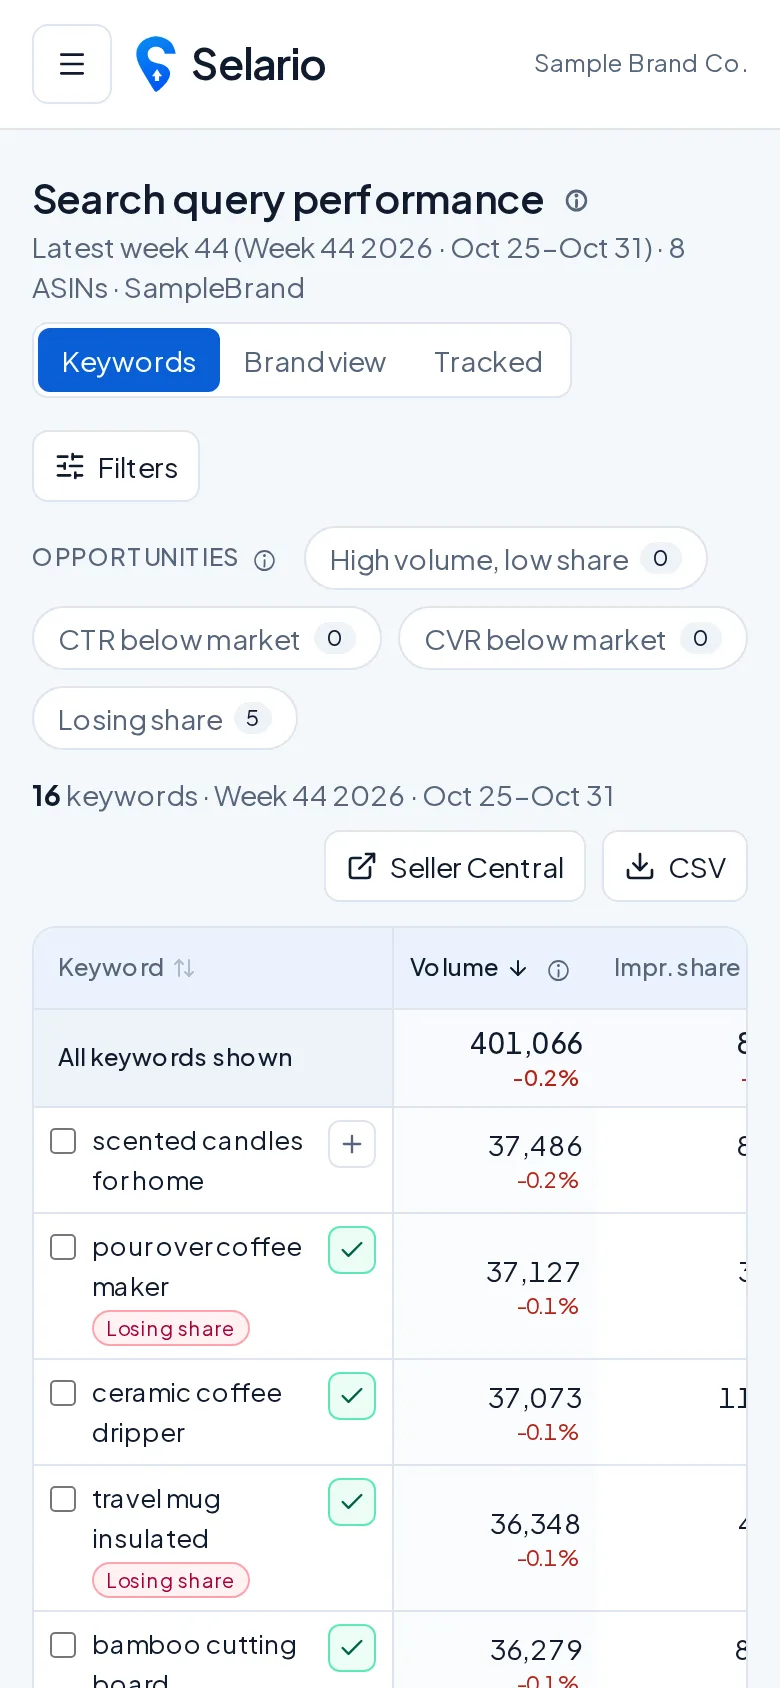
From Amazon Brand Analytics: every search query that led to your products, by week and ASIN, with impressions, clicks, add-to-carts and purchases, and your share of each. Opportunity chips point out quick wins, and a Brand view shows brand-level share. Branded-search changes also feed TikTok halo measurement.
Amazon keyword rank tracking
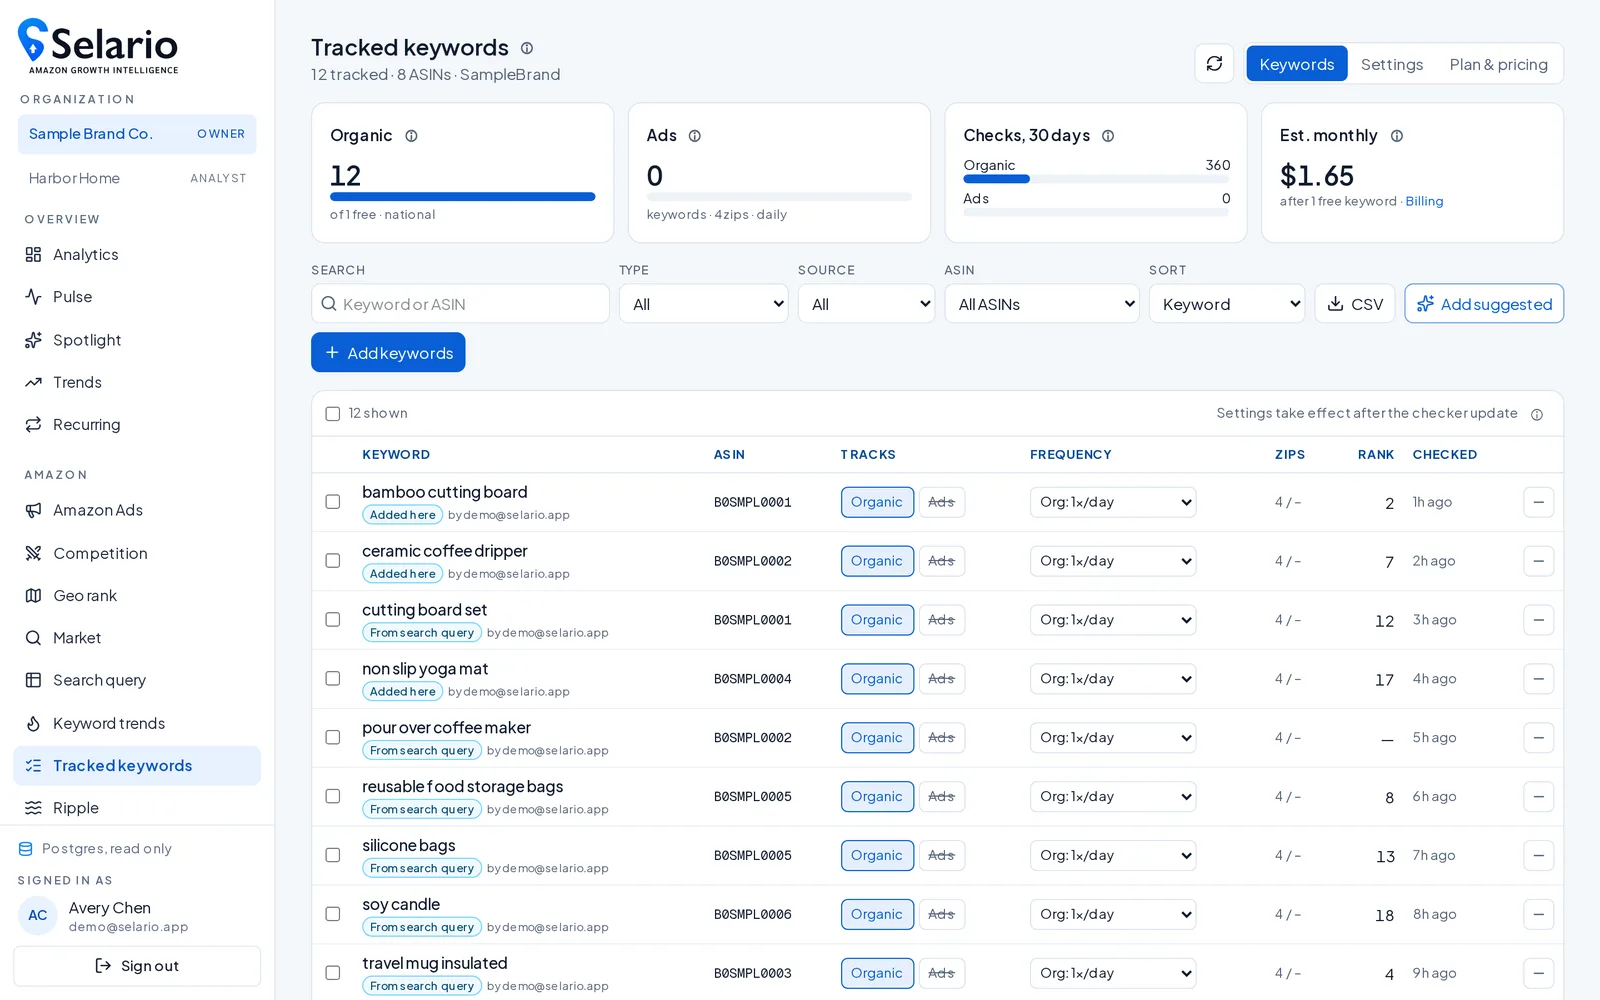
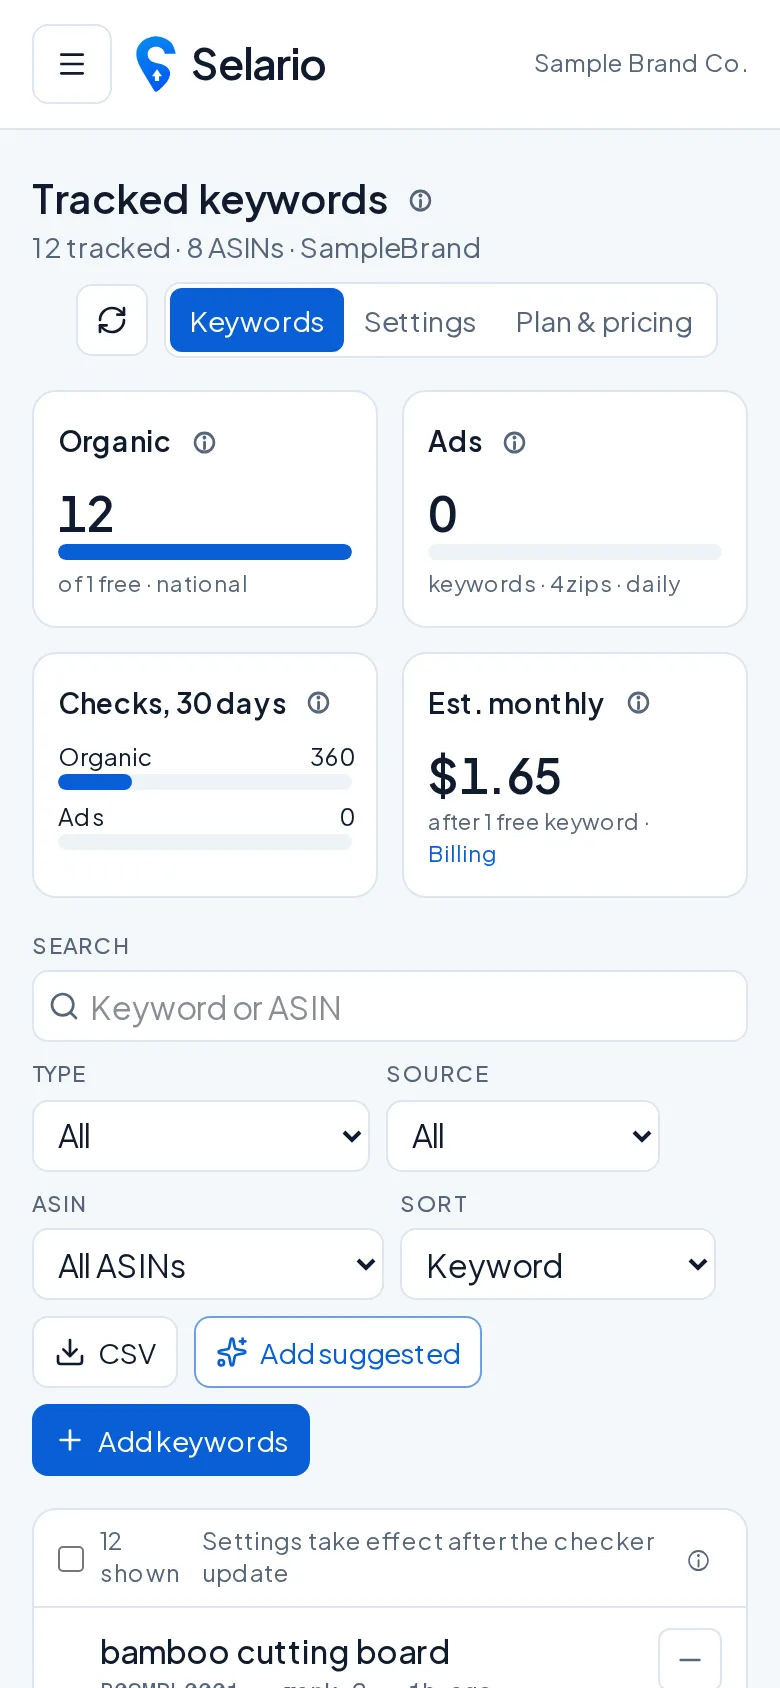
Pick ASIN + keyword pairs and Selario checks where you rank organically and where your ads show, on a schedule and in the ZIP codes you choose. Start from your SQP data with “Add suggested”, group keywords into categories and export to CSV.
Pricing
Your first tracked keyword is free with no credit card. Additional keywords start at $0.15 per keyword per month (national, once a day); ZIP codes, ads tracking and more frequent checks cost extra. Keyword trends and SQP are free while in early access. Pricing may change.
Frequently asked questions
Is Selario an Amazon keyword research tool?
Yes. Keyword Trends ranks the top 100,000 Amazon search terms from Brand Analytics and shows movers up and down, top volume and new-entrant keywords, with up to two years of history, top clicked products and click vs purchase share.
How far back does Amazon search term history go in Selario?
Up to two years. Daily ranges are 7 days to 1 year, and weekly ranges are 12 weeks to 2 years.
Can I compare keywords day over day and week over week?
Yes. Use the Daily / Weekly toggle, and the Chart / Table toggle to view trends as a chart or a table. Daily compares with 1, 7 or 28 days earlier, and weekly with 1, 4 or 12 weeks earlier.
How do I find new product ideas on Amazon with Selario?
Use New entrants and Movers up on the weekly view, filter to your categories, skip likely bot spikes, then check each term’s two-year history and its top clicked products’ click and purchase share.
What is a likely bot spike?
A search term that climbs fast while its top products get a large share of clicks but a small share of purchases. Selario flags it with a score and reasons. It is a hint, not proof.
What is the difference between click share and purchase share?
Click share is a product’s share of clicks after a search, and purchase (conversion) share is its share of purchases. High clicks with low purchases can mean weak conversion or bot traffic.
Does keyword tracking require a credit card?
No for your first keyword. A payment method is needed only to track more keywords, ads positions, extra ZIP codes or more frequent checks.
Where does search data come from?
Search terms and Search Query Performance come from Amazon Brand Analytics (brand-registered sellers).
How much history is kept?
Two years of search-term history.