 Selario
Home › Meta ads vs Amazon sales
Meta ads vs Amazon sales
Many brands run Meta ads and also sell the same products on Amazon. Selario puts Meta, Amazon and TikTok ad impressions on the same daily chart as Amazon sales, so you can see whether they move together — without calling that a causal report.
✓ Free to start, no credit card required. Free while in early access.
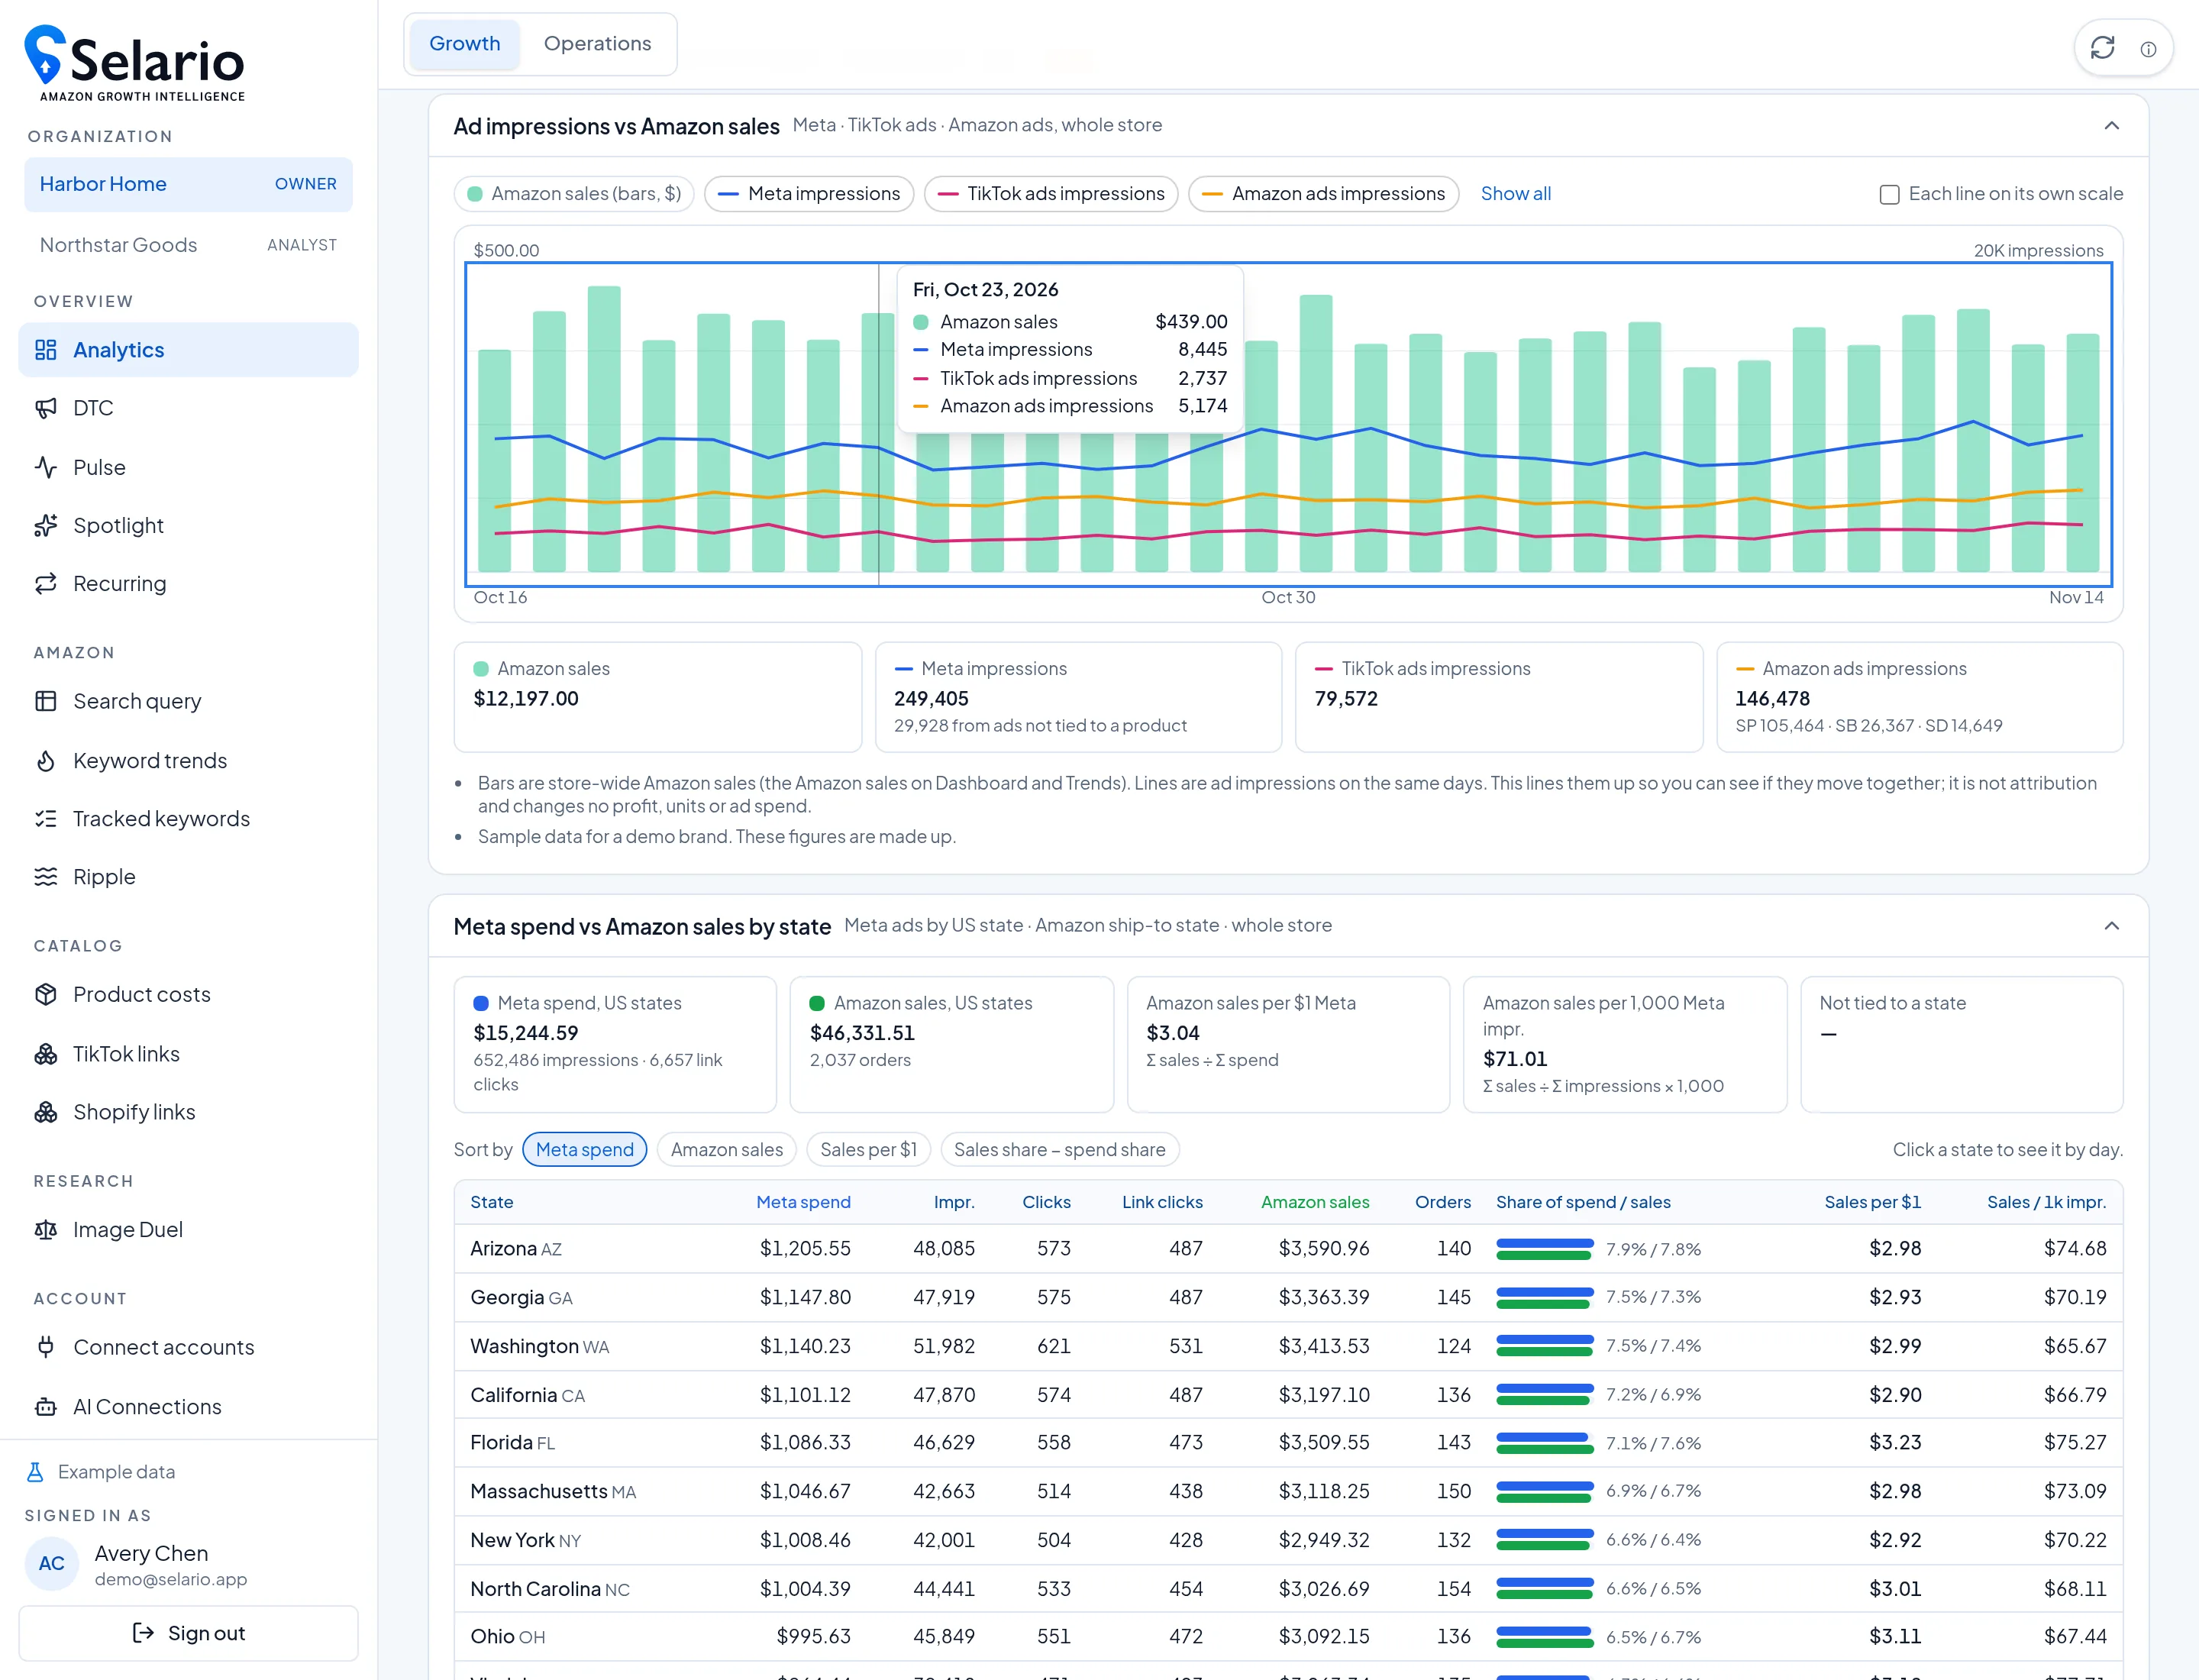
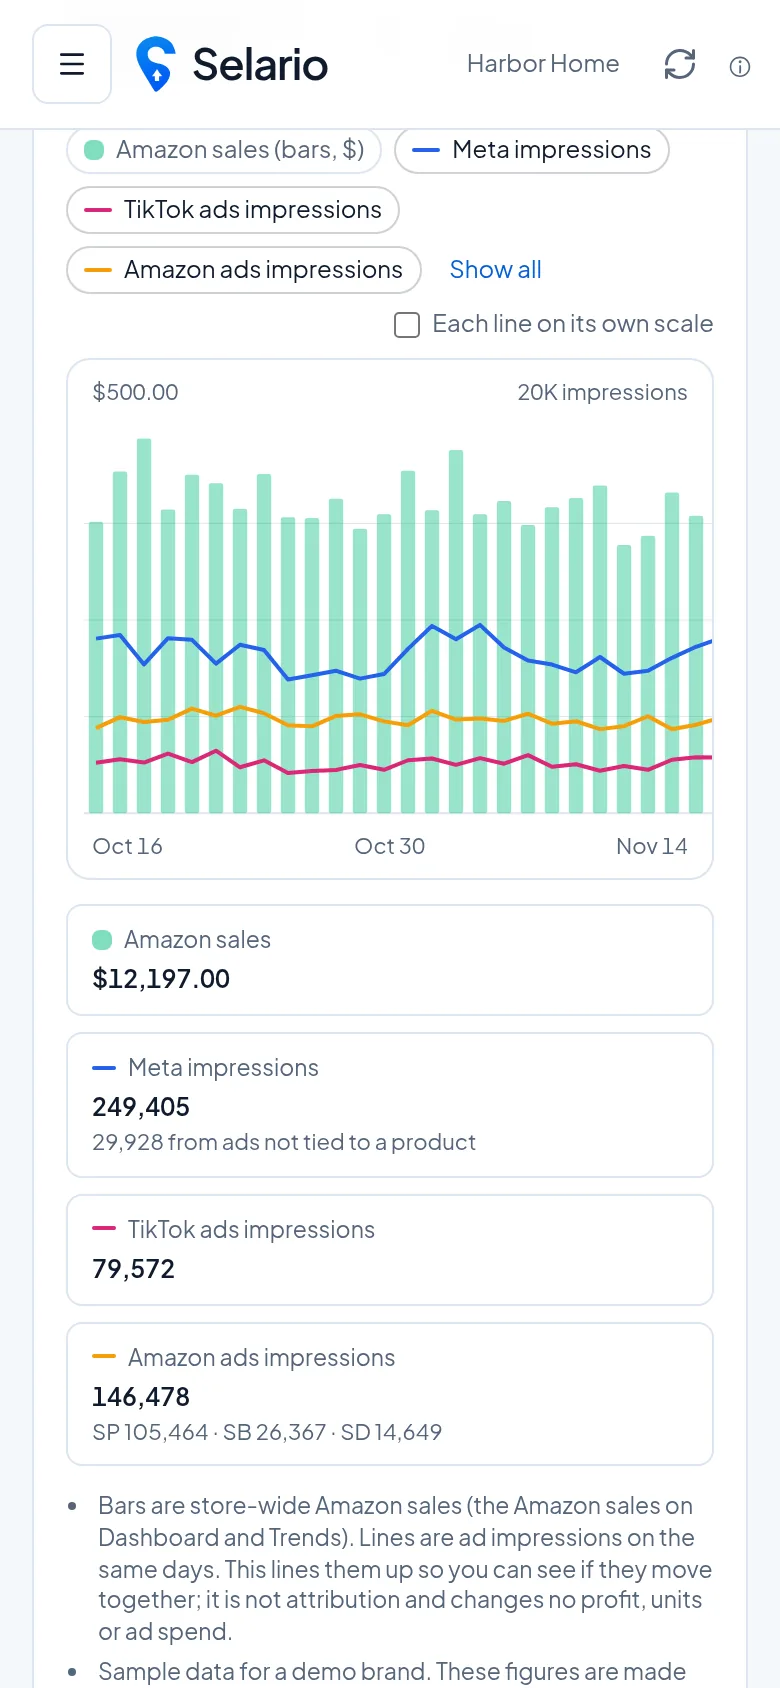
Screenshots show sample data for a fictional demo brand (Harbor Home), not a customer’s store.
What the chart shows
On Analytics → Trends, Ad impressions vs Amazon sales plots store-wide Amazon sales as bars and ad impressions as lines for the same days: Meta impressions, TikTok ads impressions and Amazon ads impressions (Sponsored Products, Sponsored Brands and Sponsored Display, when those figures are in the account). Hover any day for that date’s sales and impression counts.
The point is a simple one: if you increased Meta or TikTok ads, did Amazon sales on those days move in a similar direction? If they did not, that is also useful. The chart does not change profit, units or ad spend, and it is not an attribution model. Selario states that on the page itself.
What this is not
- Not Meta attribution of Amazon orders. Meta does not give Selario a clean “this impression caused this Amazon order” feed for this view.
- Not Amazon Attribution. Amazon Attribution is a separate Amazon report. This chart is impressions next to Amazon.com sales.
- Not a substitute for incrementality tests or media-mix modeling. Those are different methods, used by tools such as some plans of Triple Whale or Northbeam.
How it works with products and states
On a product’s Trend tab you can also see ads that were tied to that product — Amazon ads for its ASINs, Meta ads linked to it, and TikTok ads — next to marketplace sales. That is still a comparison by day and by listing, not a claim that one channel caused the other.
For a geographic view, Meta spend vs Amazon sales by US state lines Meta’s own spend, impressions and clicks (by the state people were in when they saw the ad) up with Amazon.com orders by ship-to state. Meta does not provide that view by hour, so Selario shows it by day (or week or month). Meta also does not report website purchases by state, so those are not in the table.
How to open it
In Selario, go to Analytics → Trends. The impressions chart is at the top of that tab. Hover a day (or tap it on a phone) for that date’s Amazon sales and Meta, TikTok and Amazon ad impressions. The screenshot here uses sample Harbor Home data, including a hover card for Friday, October 16, 2026.
Why this search matters
Sellers often ask whether Facebook or Instagram ads are “working” on Amazon. The honest first step is to look at the two series together, with the same dates and a clear label that this is not proof of cause. Selario is built for that read, next to Shopify profit by ad for the store itself and Ripple for TikTok Shop’s estimated lift on Amazon.
How to read a mixed result
A useful first pass is to look at the shape, not a single day. If Meta impressions stepped up for a week and Amazon sales stayed flat, that is a reason to check creative, audience, price or stock — not automatic proof that the ads “failed,” because Amazon sales also move with promotions, inventory and organic rank. If sales rose with impressions, treat that as a clue and confirm it with product-level Trend and, on the Shopify store, with profit by ad.
The hover card is there so you can read the actual figures for a date: Amazon sales, Meta impressions, TikTok ads impressions and Amazon ads impressions (Sponsored Products, Sponsored Brands and Sponsored Display when those are in the account). The chart also has an option to put each line on its own scale when the units differ a lot, which they often do (dollars vs impressions).
What you need connected
Amazon Seller Central and Amazon Ads for the sales bars and Amazon impression lines; Meta ads for Meta impressions; TikTok Ads if you want that line. Nothing in this chart is inferred by splitting a national total with a made-up model. If a source is missing, that line is absent rather than filled with a guess. The footnote on the chart states that the figures are a comparison and that sample screenshots use a demo brand.
Related: Meta spend by state · Amazon, Shopify and TikTok profit · Shopify and Amazon analytics.
Frequently asked questions
Can Selario prove Meta ads caused Amazon sales?
No. The Trends chart compares Meta, Amazon and TikTok ad impressions with Amazon sales on the same days. Movement together is a clue, not proof of cause.
Which ad impressions are included?
Meta impressions, TikTok ads impressions and Amazon ads impressions (Sponsored Products, Sponsored Brands and Sponsored Display when those figures are available), next to store-wide Amazon sales.
Is there a state-level view?
Yes. Meta spend vs Amazon sales by US state compares Meta’s own state-level ad numbers with Amazon.com ship-to-state sales. It is also a comparison, not attribution.
Is Selario free?
Dashboards are free during early access, with no credit card required.