 Selario
Home › Subscribe & Save analytics
Amazon Subscribe & Save analytics
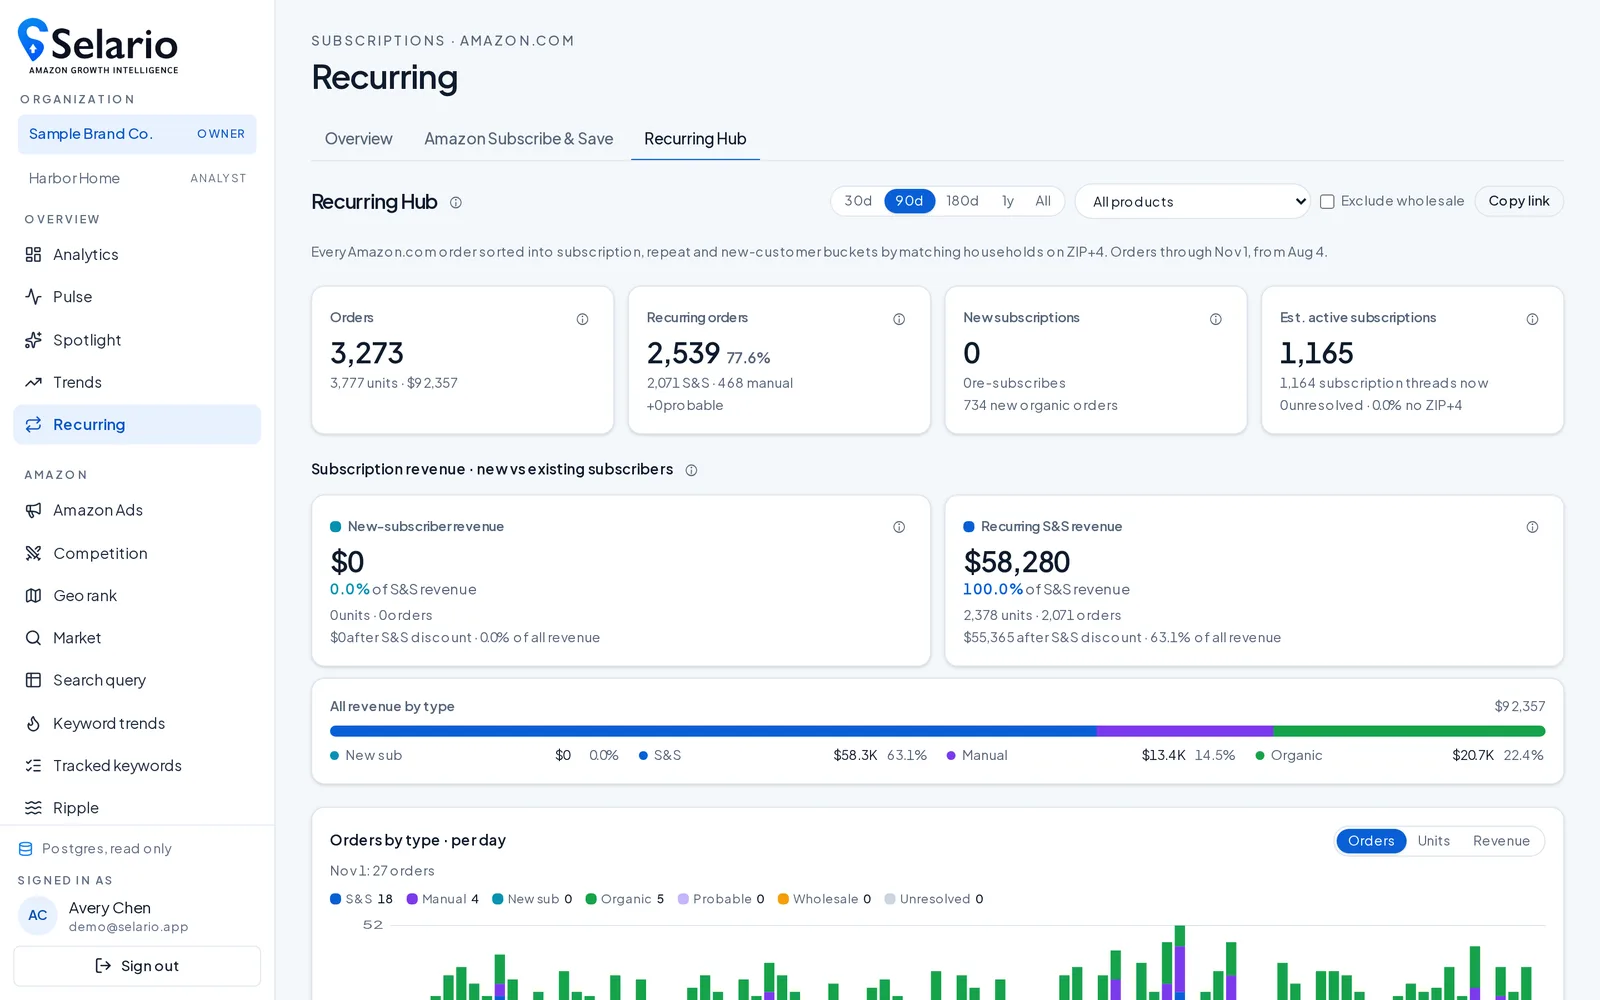
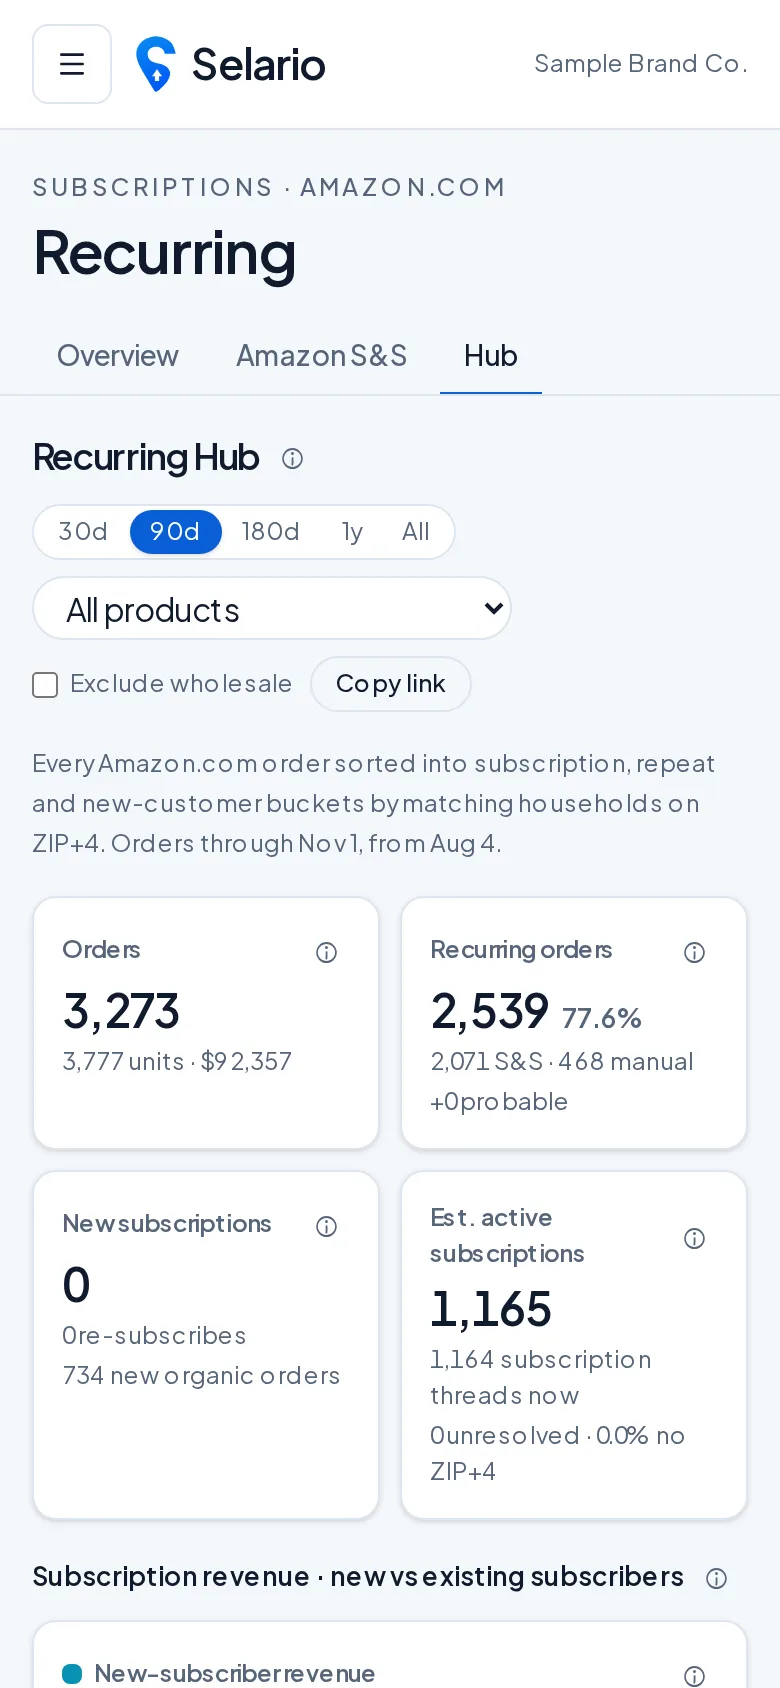
Recurring shows your Amazon Subscribe & Save business: how many subscribers you have, what they’re worth, and which products drive repeat orders.
✓ Free to start, no credit card required. Free while in early access.
See your recurring revenue on Amazon
Subscribe & Save (S&S) turns one-time buyers into repeat orders, but Seller Central spreads the numbers across several reports. Selario’s Recurring dashboard brings them together: active subscribers, S&S revenue, penetration (the share of units sold through subscriptions), coupon share and discount tier per product.
Protect subscribers from stock-outs
Out-of-stock S&S products can cost you subscribers. Recurring compares each product’s stock with the next 30 days of subscriber demand and flags products that can’t cover it, with an out-of-stock-lost estimate.
Subscriber value and retention
Account economics compare subscriber and non-subscriber average revenue and lifetime value, and the history view shows how subscribers grow or churn over time. Filter products by growing, shrinking or stock risk.
Frequently asked questions
Where does Subscribe & Save data come from?
From your Amazon Seller Central account, connected read-only.
Is it free?
Free to start, no credit card required. Free while in early access.