 Selario
TikTok Shop + Amazon analytics
See how TikTok Shop lifts your Amazon sales.
Selario measures the TikTok halo effect — the extra Amazon sales, branded searches and profit that follow TikTok Shop and creator activity — and puts it next to every Amazon number you need: sales, profit, FBA inventory, Subscribe & Save, search query performance and keyword trends.
✓ Free to start, no credit card required. Free while in early access.
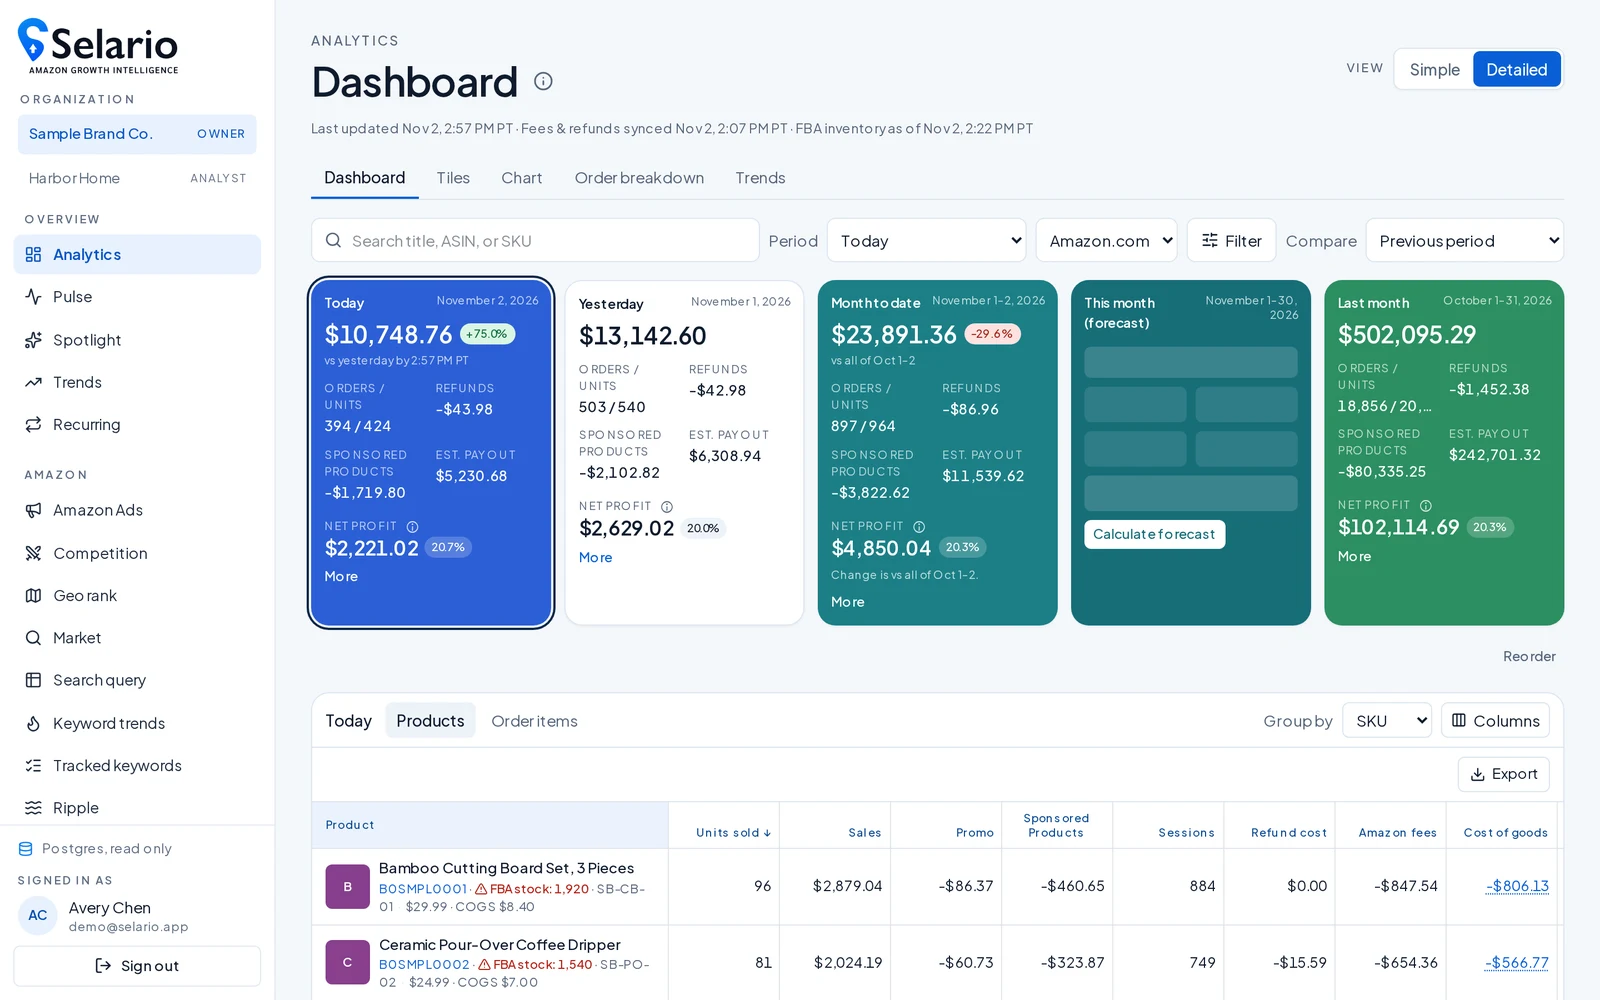
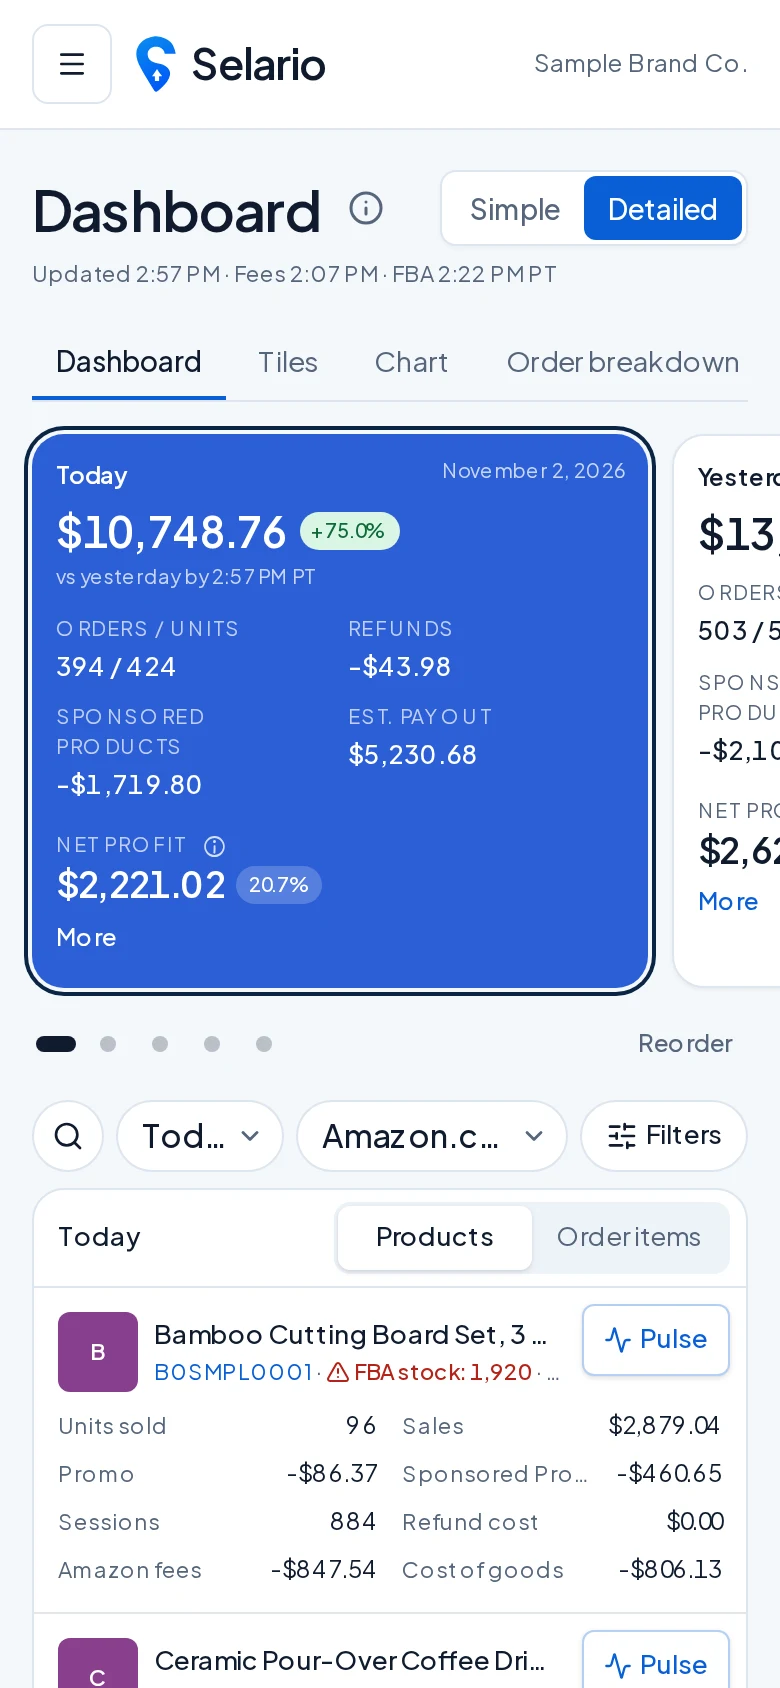
Live, not last week
Today’s sales, orders and ad spend, hour by hour, with a month-end forecast.
Real profit
Enter product costs once and see net profit per product and per period.
Search & keywords
Brand Analytics search terms, rank tracking and trends with categories.
Read-only & private
Selario never changes your listings. Every account’s data is isolated.
Ripple · TikTok halo
Does TikTok increase your Amazon sales?
TikTok Shop reports only count TikTok orders. Ripple estimates the extra Amazon units, branded searches and halo profit TikTok drives for each product, with an 80% range and a verdict: Grow, Fading or Unproven.
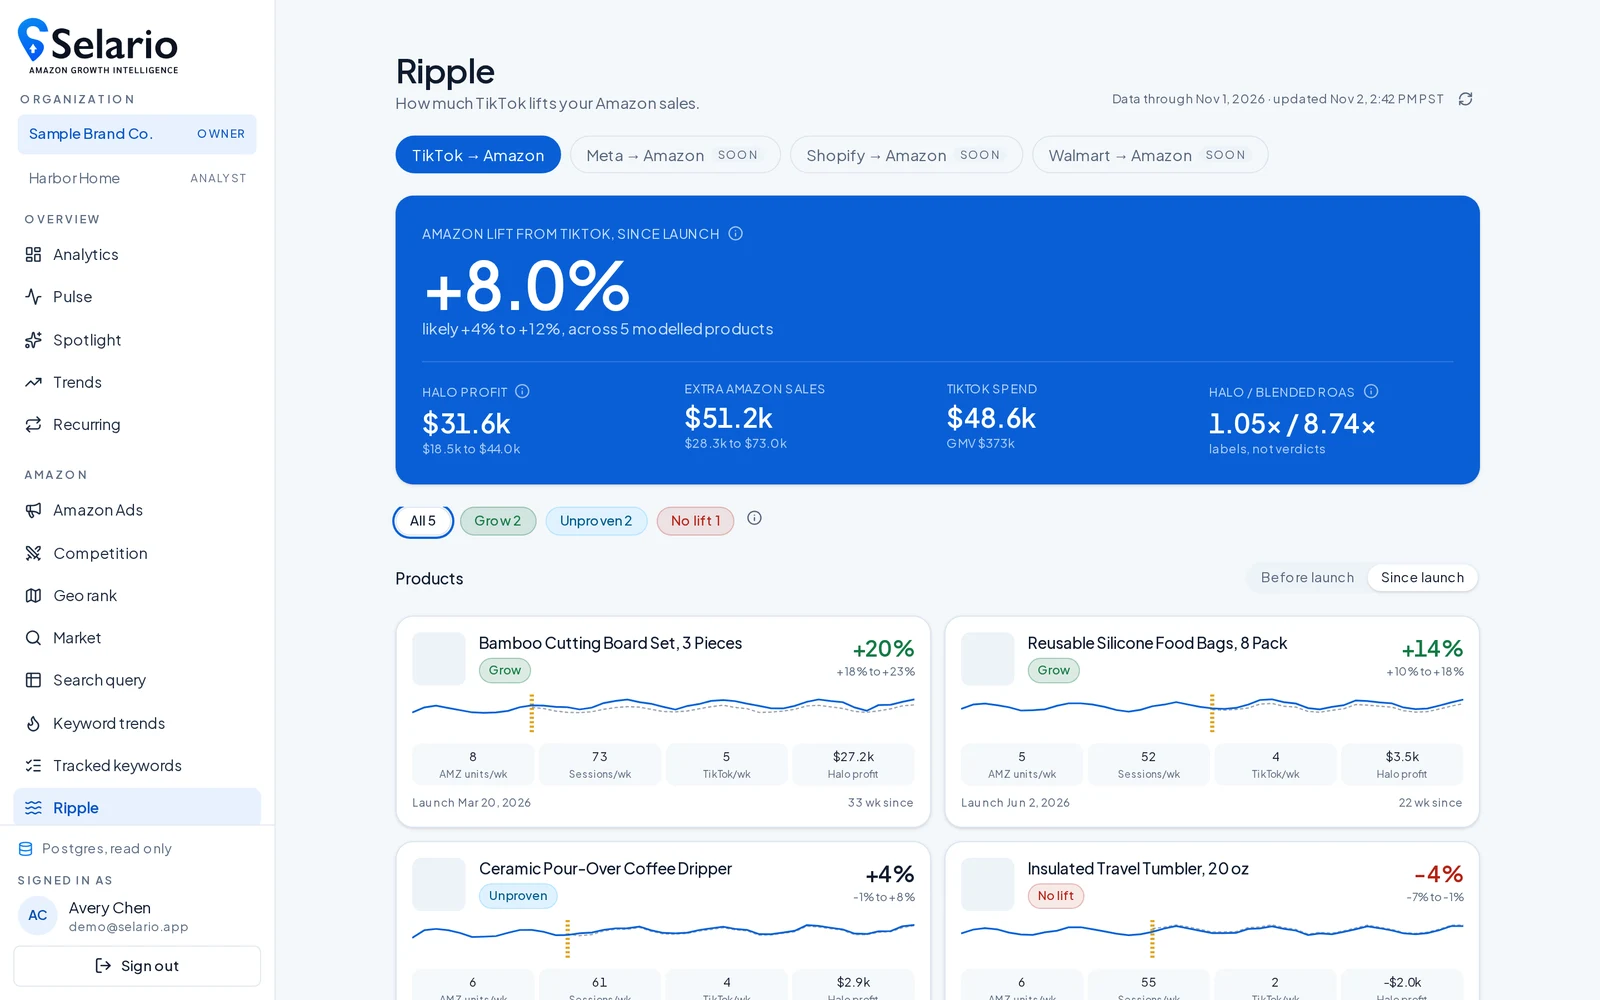
Image Duel · new
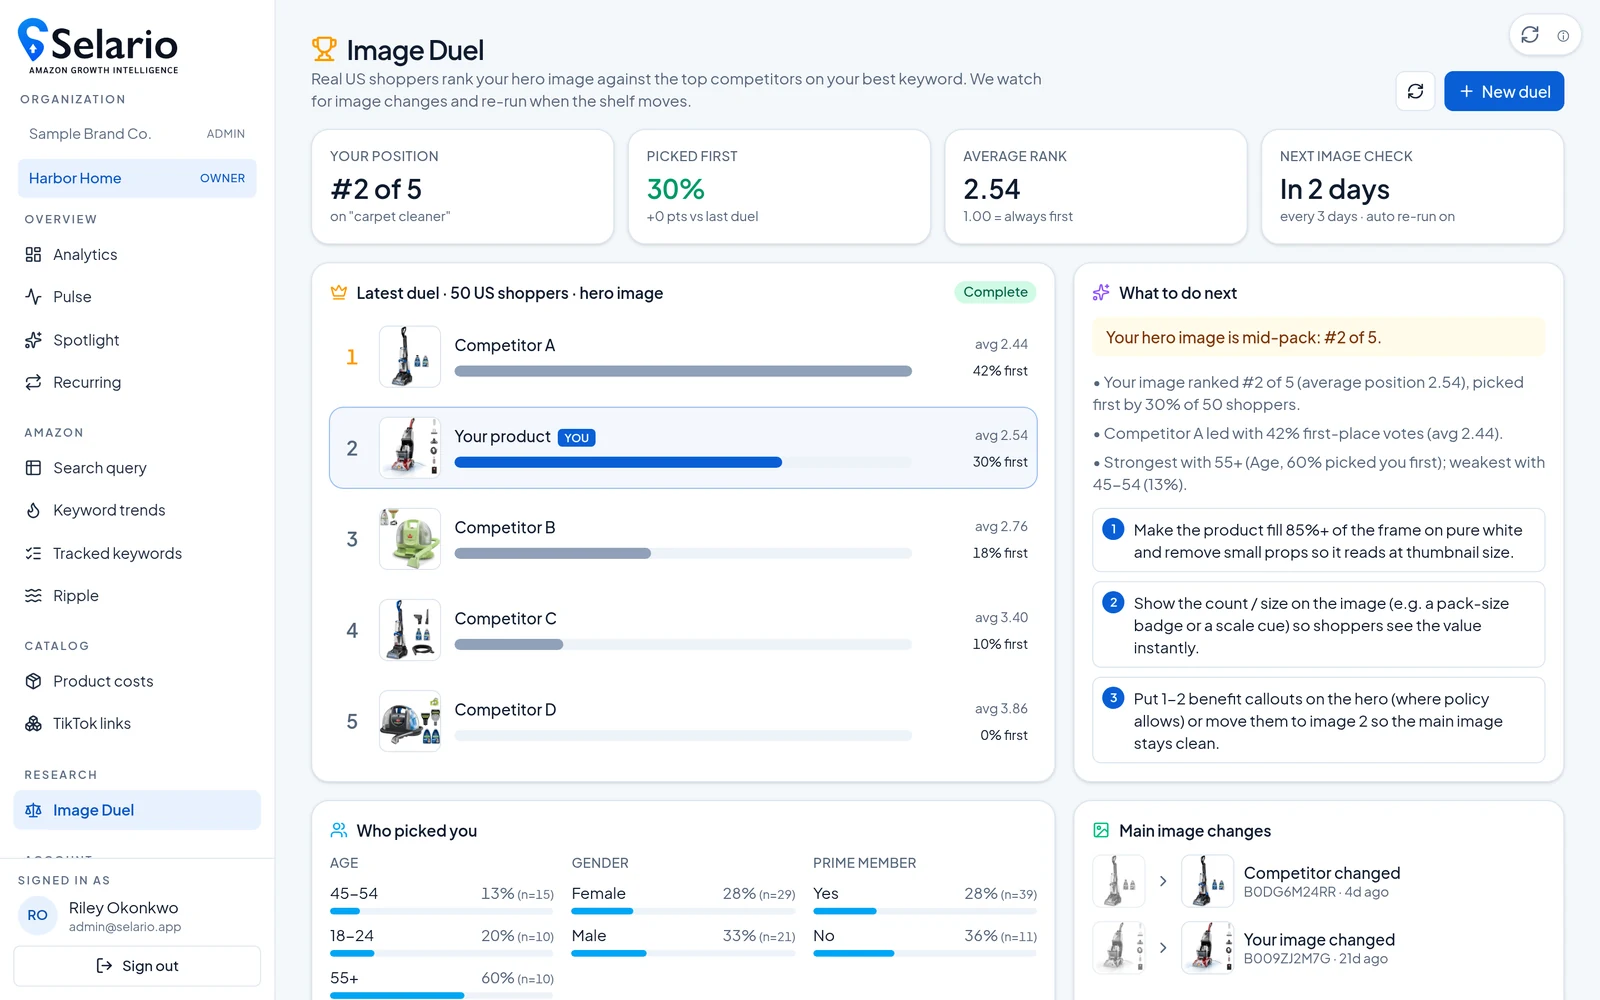
Is your main image winning the click?
Real shoppers vote between your hero image and your top 3–5 organic competitors, picked from your keyword rank tracking. Re-polls automatically when a competitor changes its image. From $2 per vote.
A tour of every dashboard
Tap ⓘ for a quick explanation, or jump to a dashboard:
Overview
Dashboard
Your whole Amazon store on one screen.
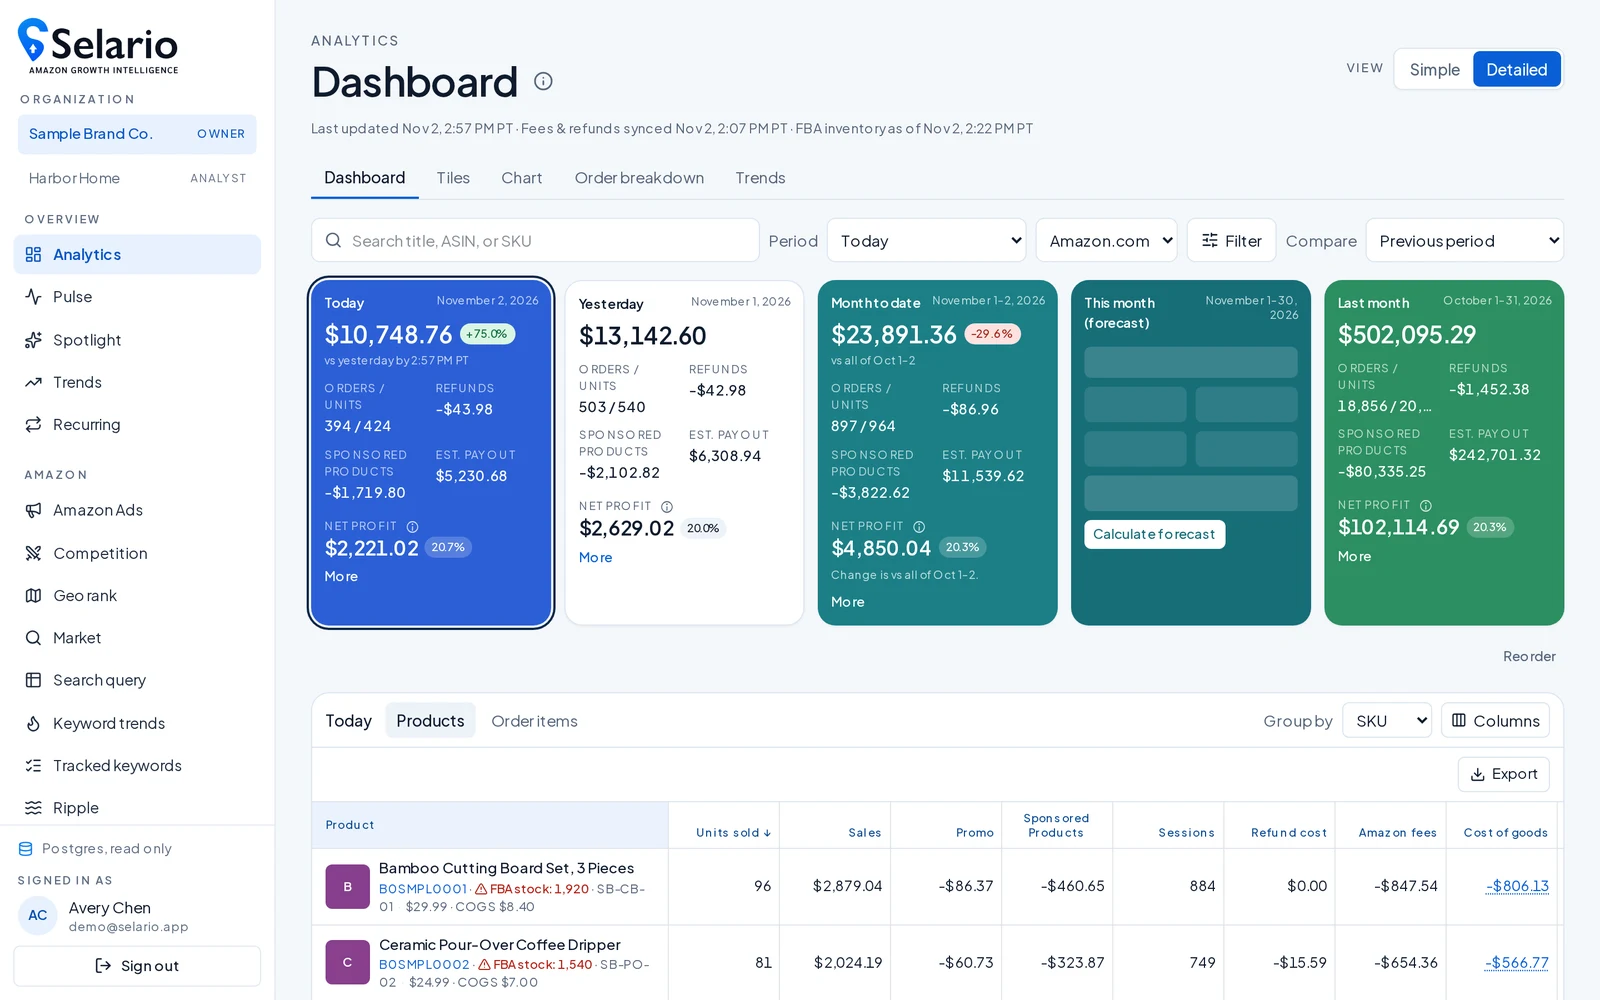
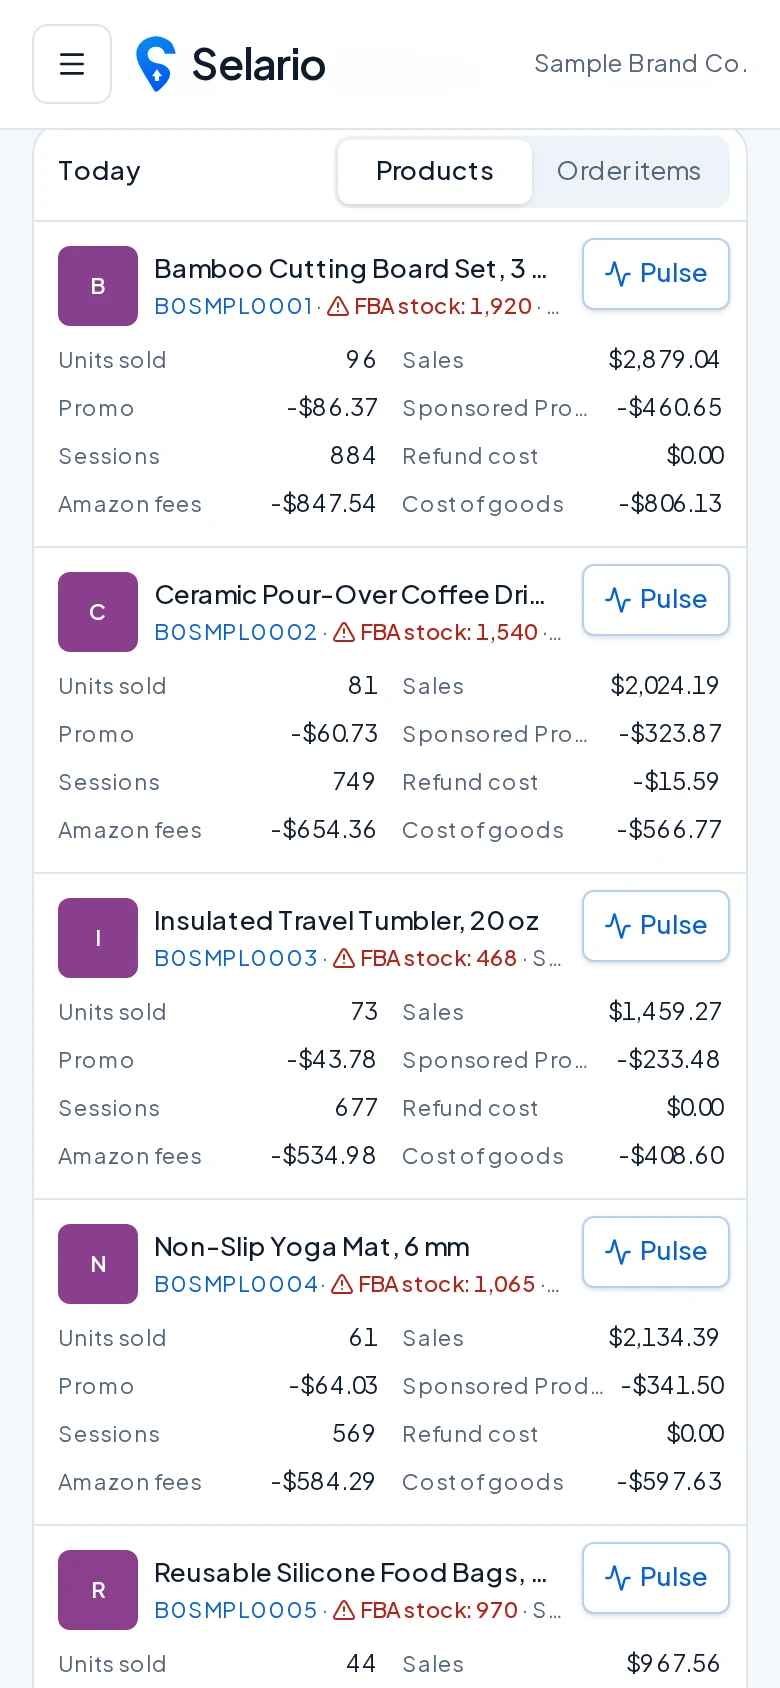
Five period cards across the top — Today, Yesterday, Month to date, a month-end Forecast and Last month — each with sales, orders, units, Sponsored Products spend and net profit. Tap any card and the whole page switches to that period. Below, every product is listed with units, promo, refunds, ad spend, cost of goods and net profit.
How to use it
- Tap a period card to change the whole page.
- Switch Simple / Detailed to show more or fewer columns.
- Sort by any column; filter by marketplace or ASIN.
- Net profit uses the product costs you enter in Product costs.
▶ Watch the 2:15 Dashboard walkthrough
Recorded with labelled example data.
Overview
Order breakdown
See where every order came from.
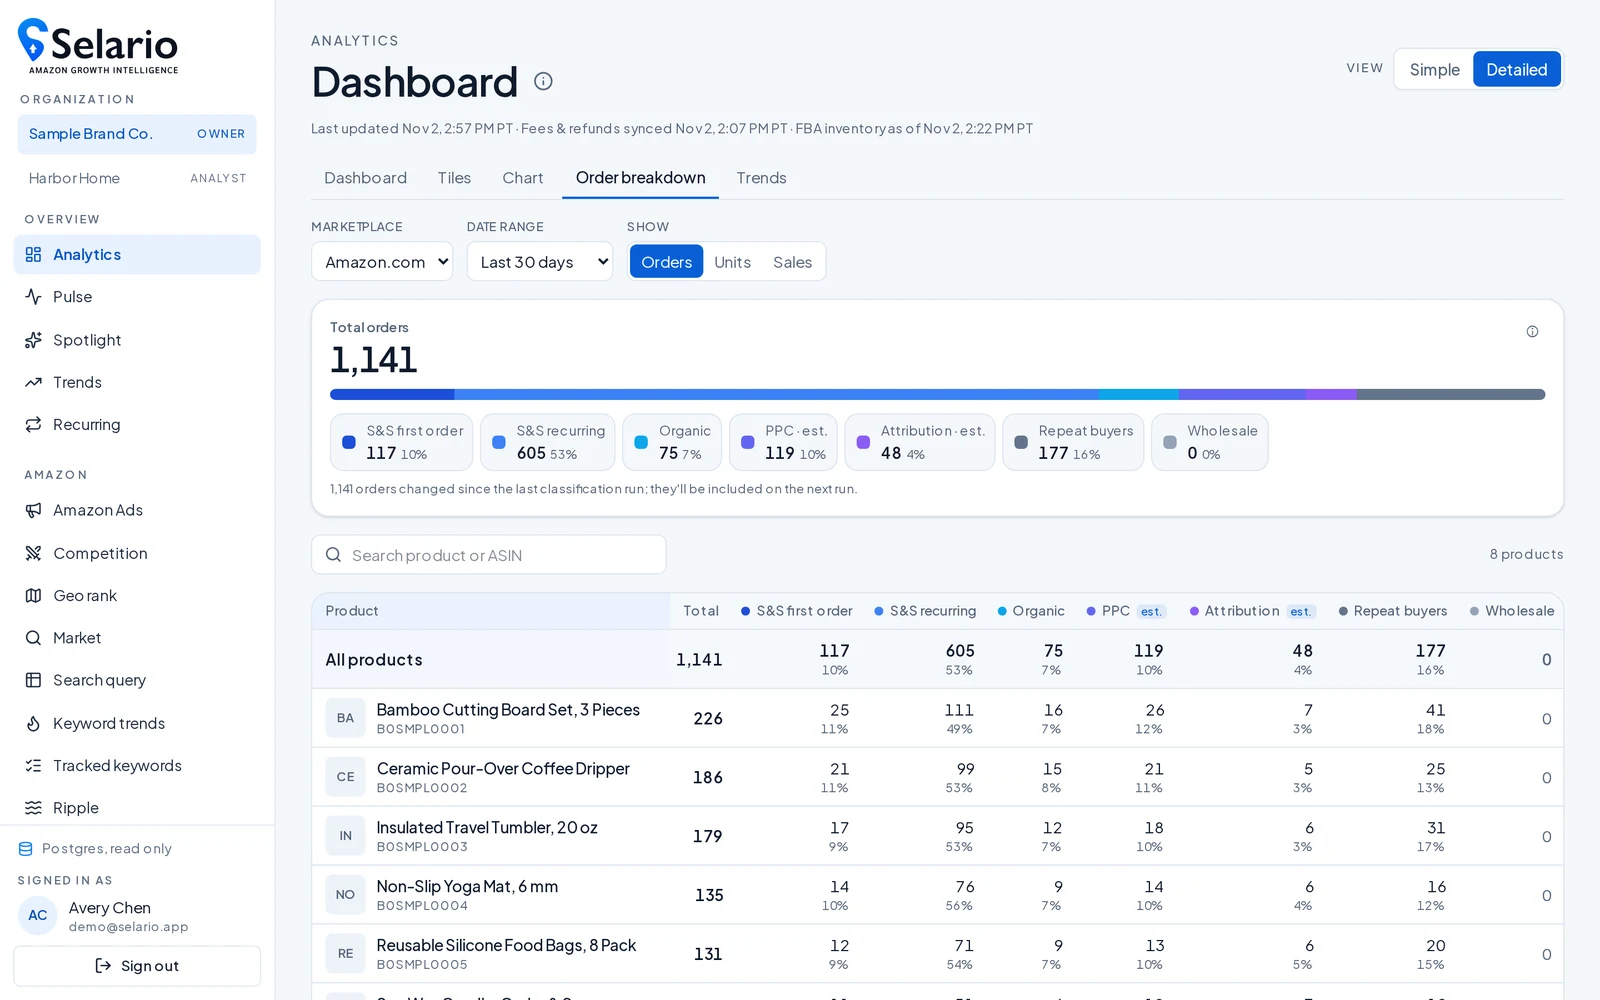
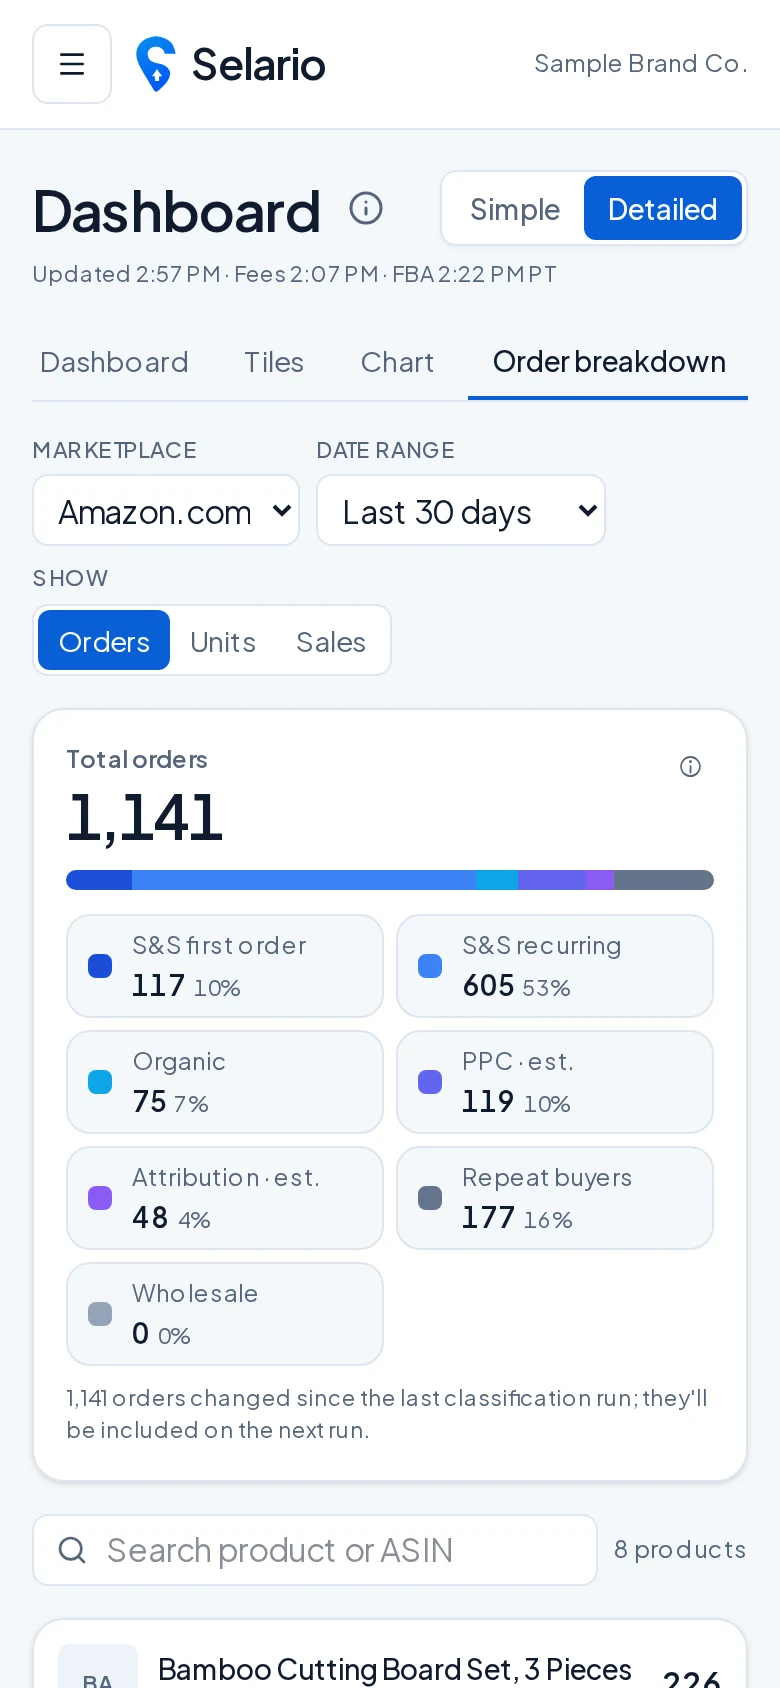
The Order breakdown tab splits orders for the chosen range by product and by source (organic vs. advertising and more), so you can tell which sales you earned and which you paid for.
How to use it
- Pick a date range (e.g. Last 30 days).
- Switch between orders, units and sales.
- Read the totals row first, then the per-product rows.
Overview
Inventory: FBA + TikTok stock
Know before you run out.
Every product row shows a stock badge with Amazon FBA units on hand and, for linked items, TikTok Shop warehouse stock, plus days of cover at the current sales pace. On the iPhone app you can turn on low-stock alerts, sent when an item drops to 60 and then 21 days of stock.
How to use it
- Open Dashboard → Products to see stock badges.
- Link TikTok products in Catalog → TikTok product links.
- Turn on notifications in the iPhone app for low-stock alerts.
Overview
Pulse
Hour-by-hour order pace, live.
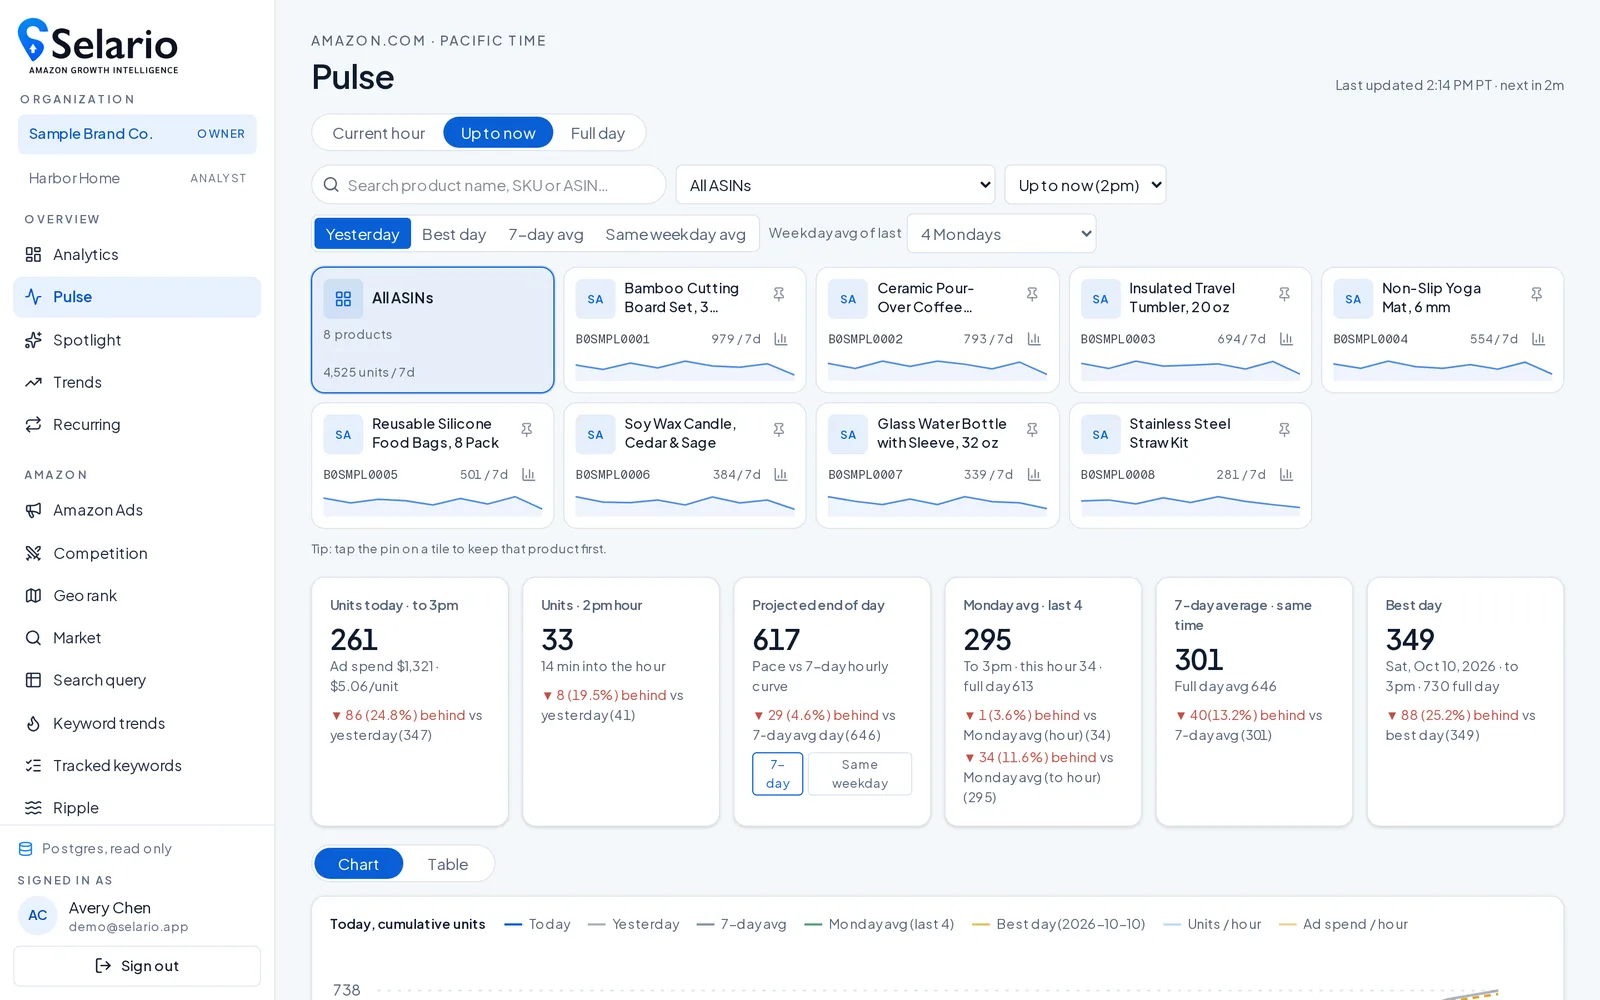
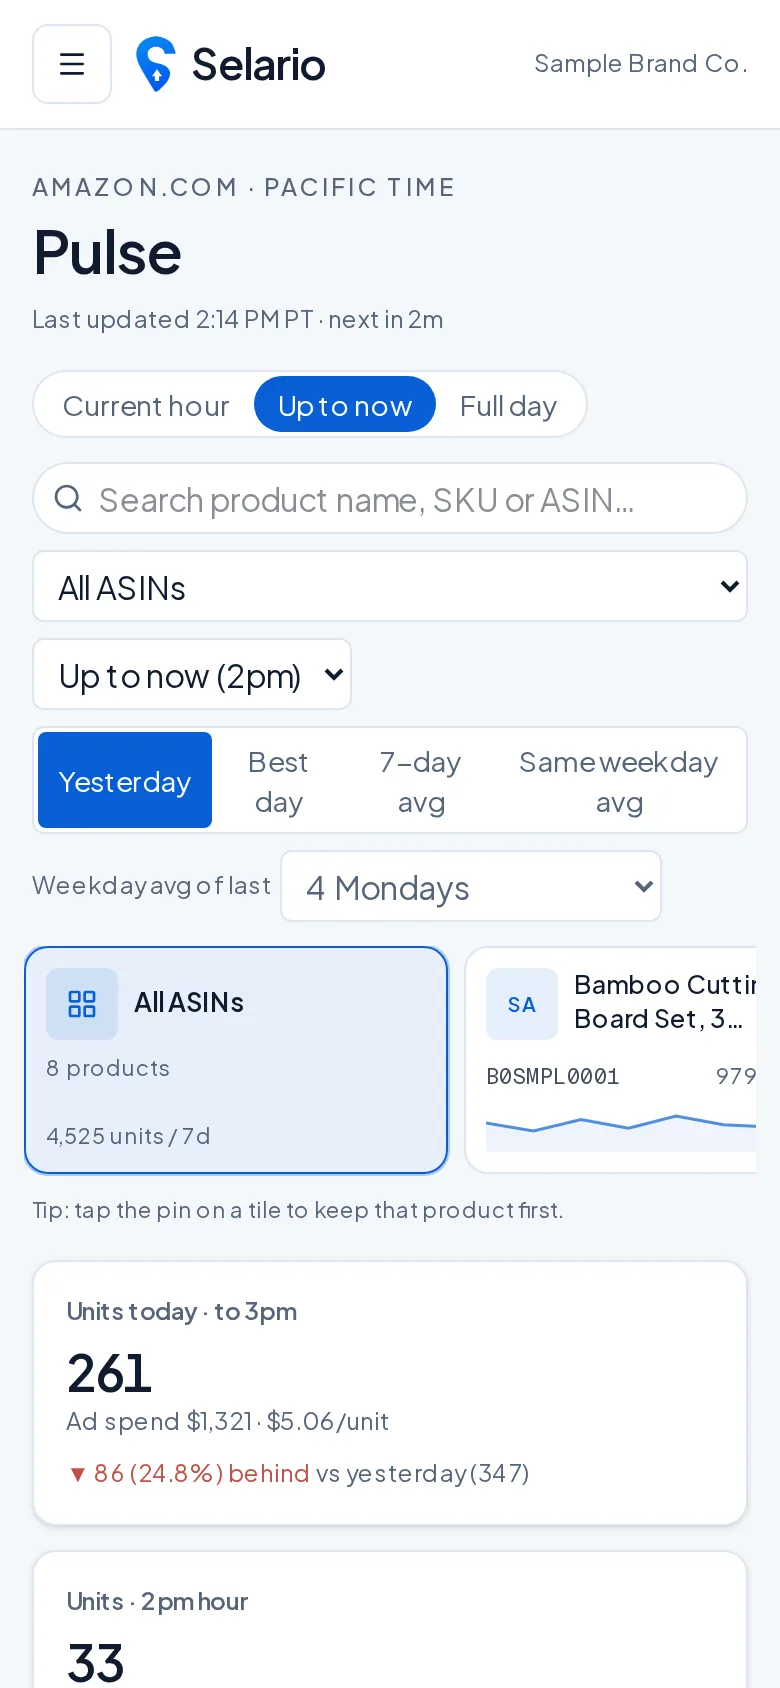
Pulse shows how today is pacing hour by hour in Pacific time against yesterday, the 7-day average and the same weekday — for the whole store or for products you pin. You see right away when a listing stalls, a coupon kicks in or an ad budget runs out.
How to use it
- Choose Current hour, Up to now or Full day.
- Pick what to compare against: yesterday, best day, 7-day or same-weekday average.
- Tap the pin on a tile to keep that product at the top.
Overview
Spotlight
Your hero products, under a microscope.
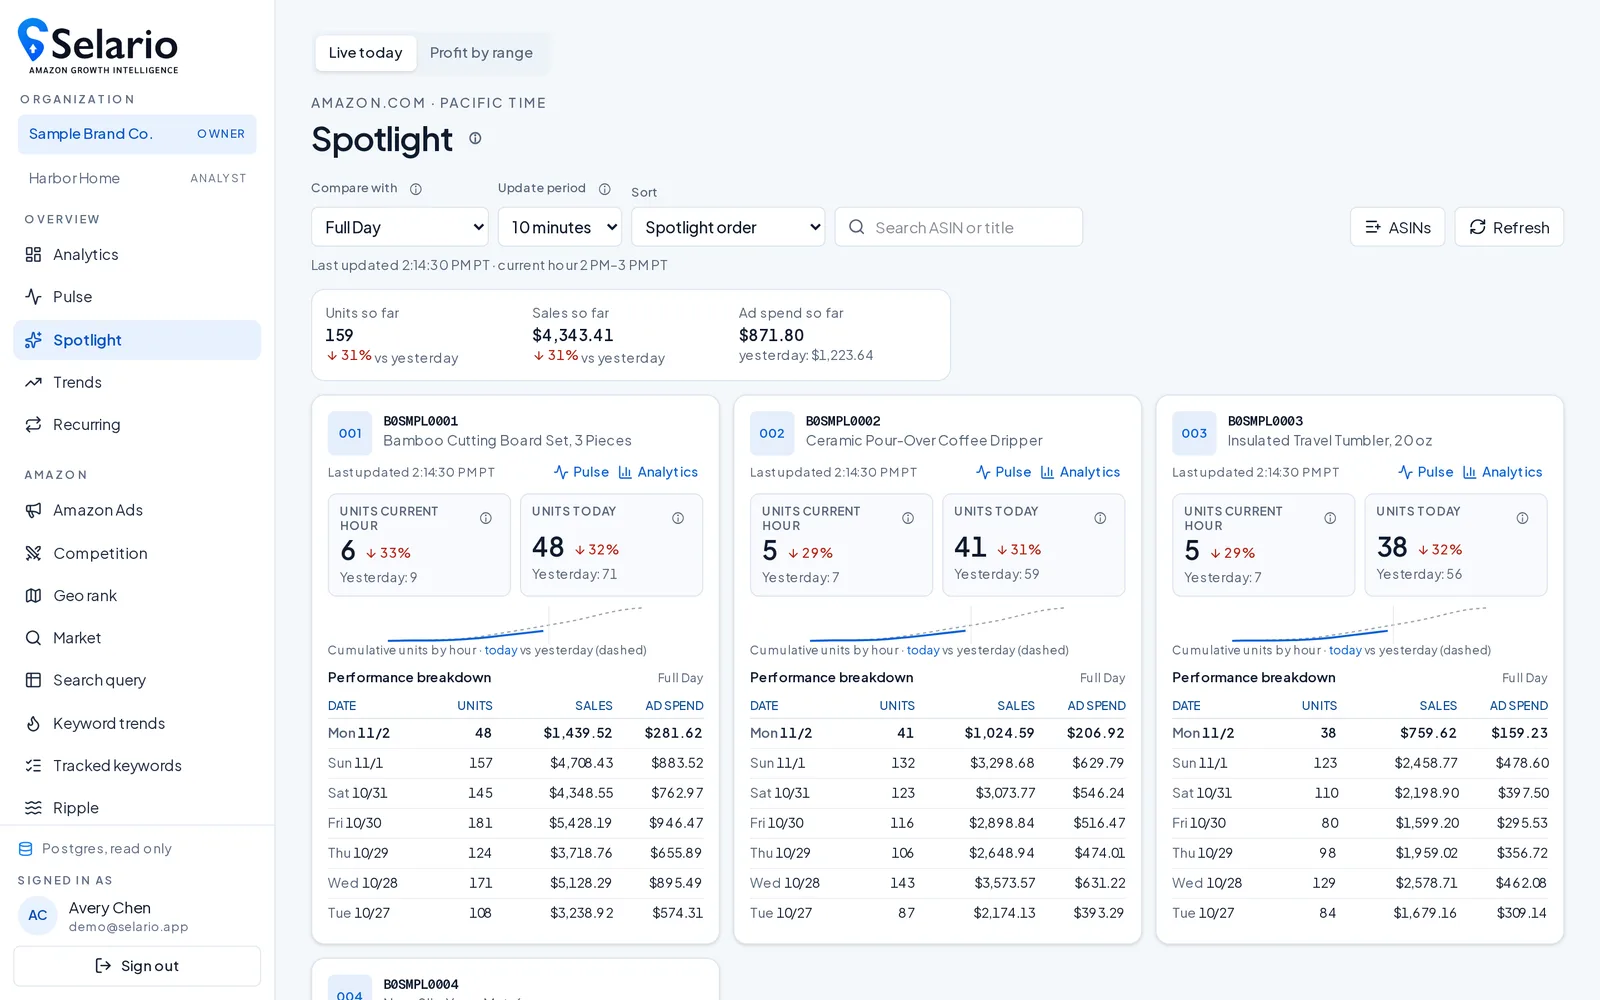
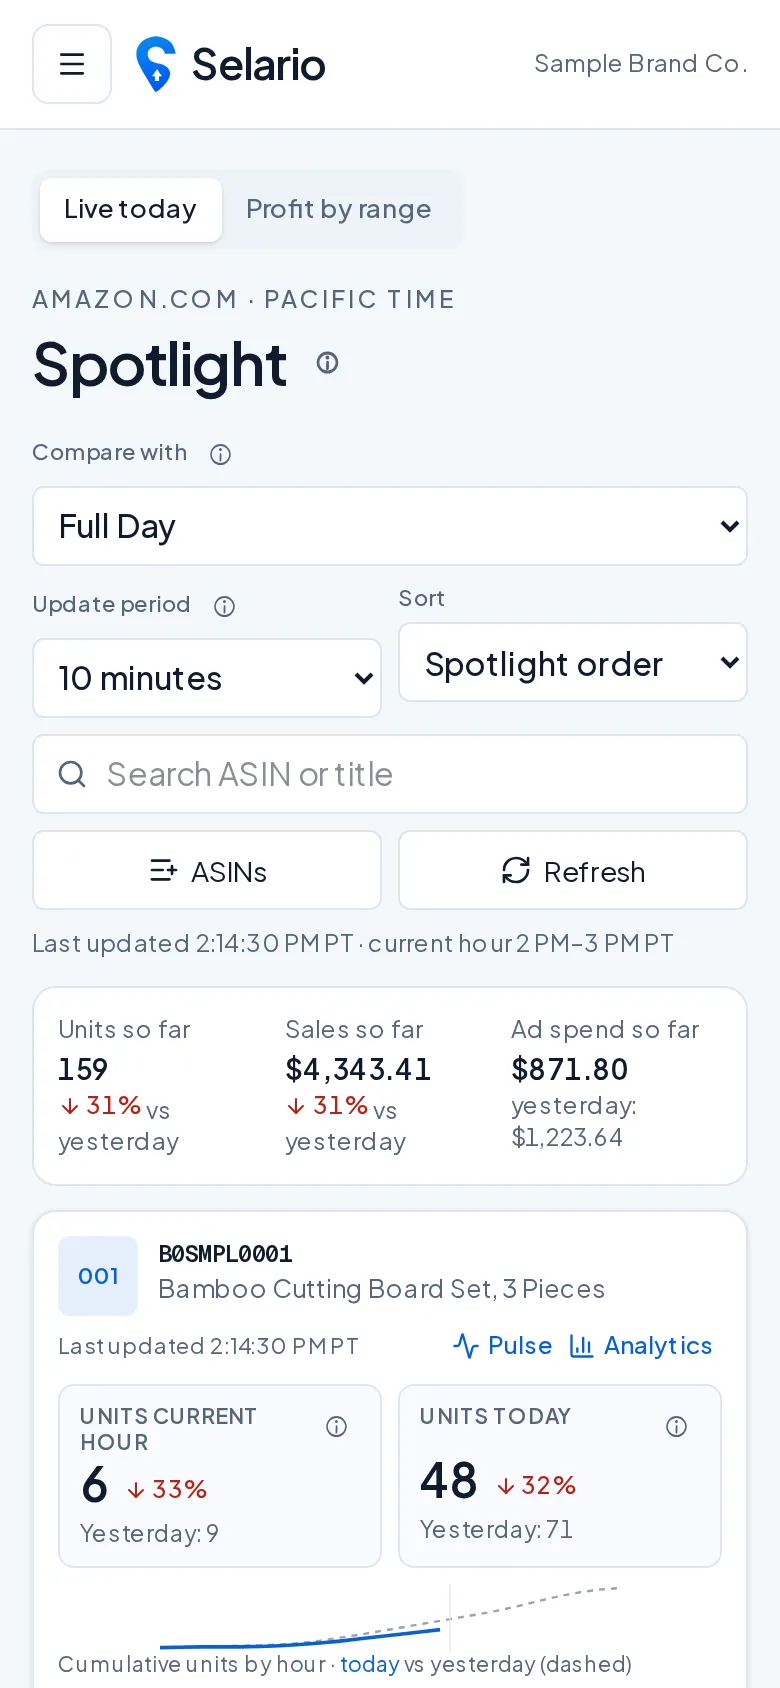
Spotlight follows the ASINs you pick: units this hour and today vs yesterday, sales, ad spend, a 7-day breakdown and profit by range. It refreshes on a schedule you set (for example every 10 minutes).
How to use it
- Add ASINs with “+ ASINs”.
- Set the update interval and the comparison.
- Use Profit by range for a quick P&L per product.
Overview
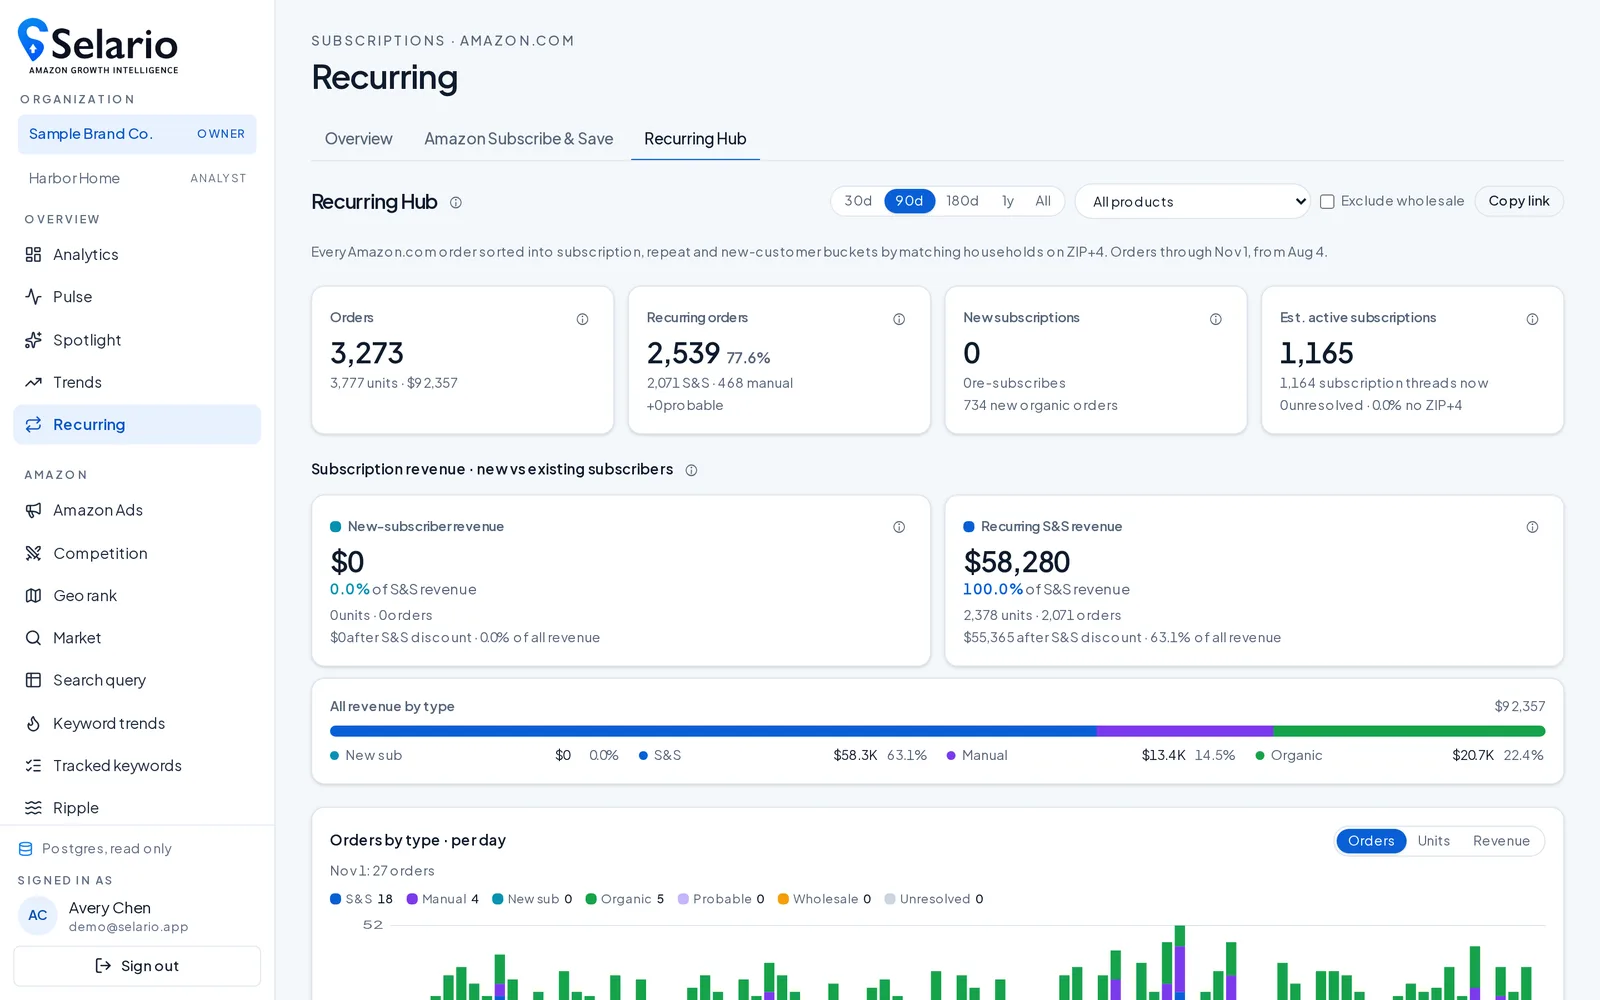
Recurring (Subscribe & Save)
Grow and protect your subscriber base.
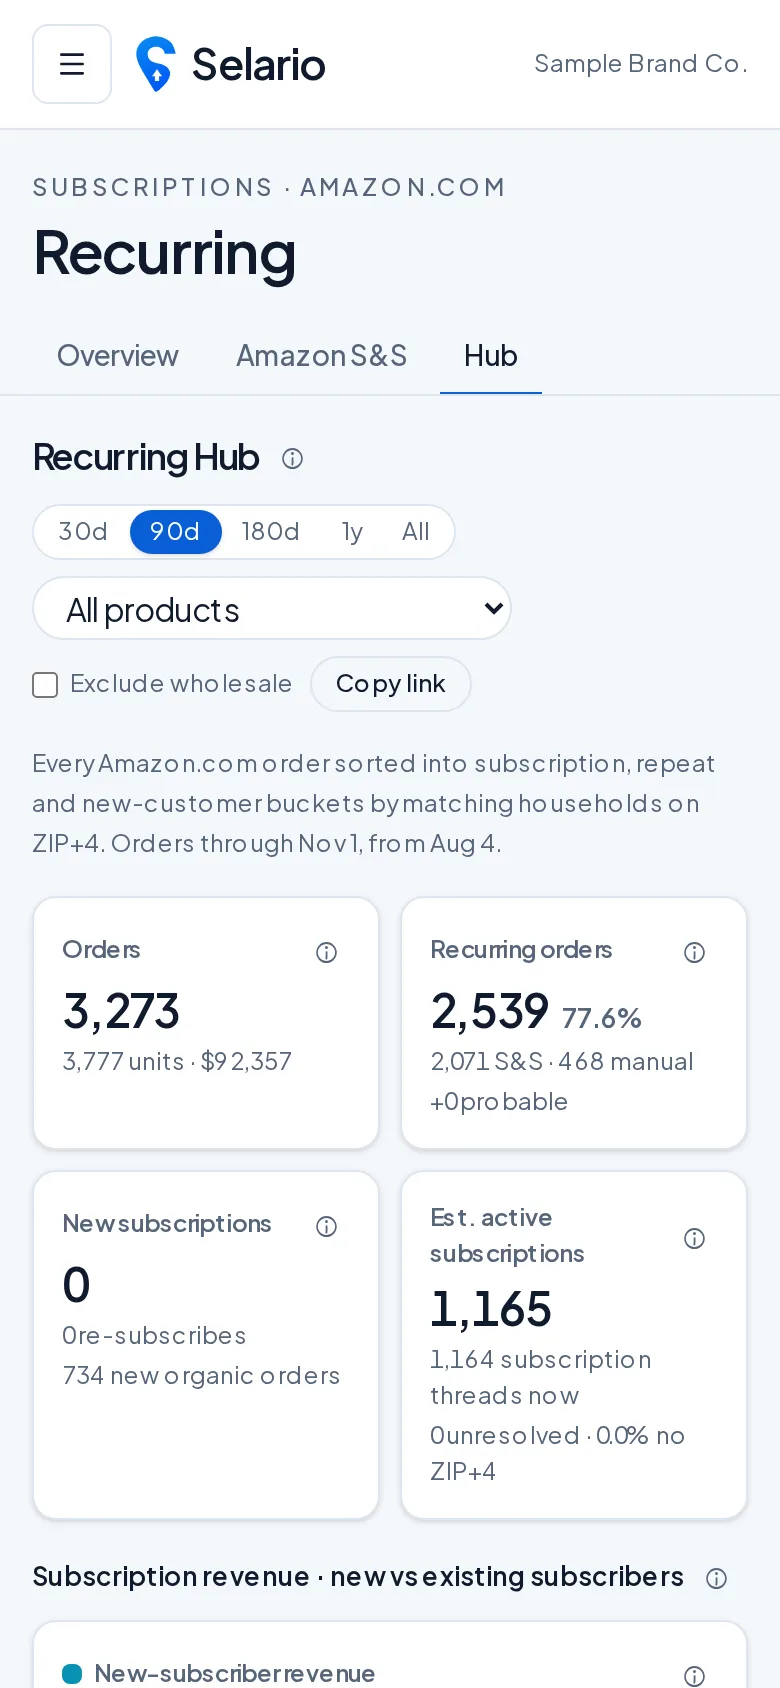
Recurring tracks your Amazon Subscribe & Save business: active subscriptions, monthly S&S revenue, penetration, retention and next-30-day revenue, with history. It warns when FBA stock can’t cover upcoming subscription deliveries. The Hub tab gives you a recurring-shopper view across products.
How to use it
- Start on Overview for the headline numbers.
- Check the red stock warnings first — they cost subscribers.
- Use the Products table to find SKUs with low penetration.
More on Subscribe & Save analytics →
▶ Watch the 2:36 Recurring walkthrough
Recorded with labelled example data.
Amazon research
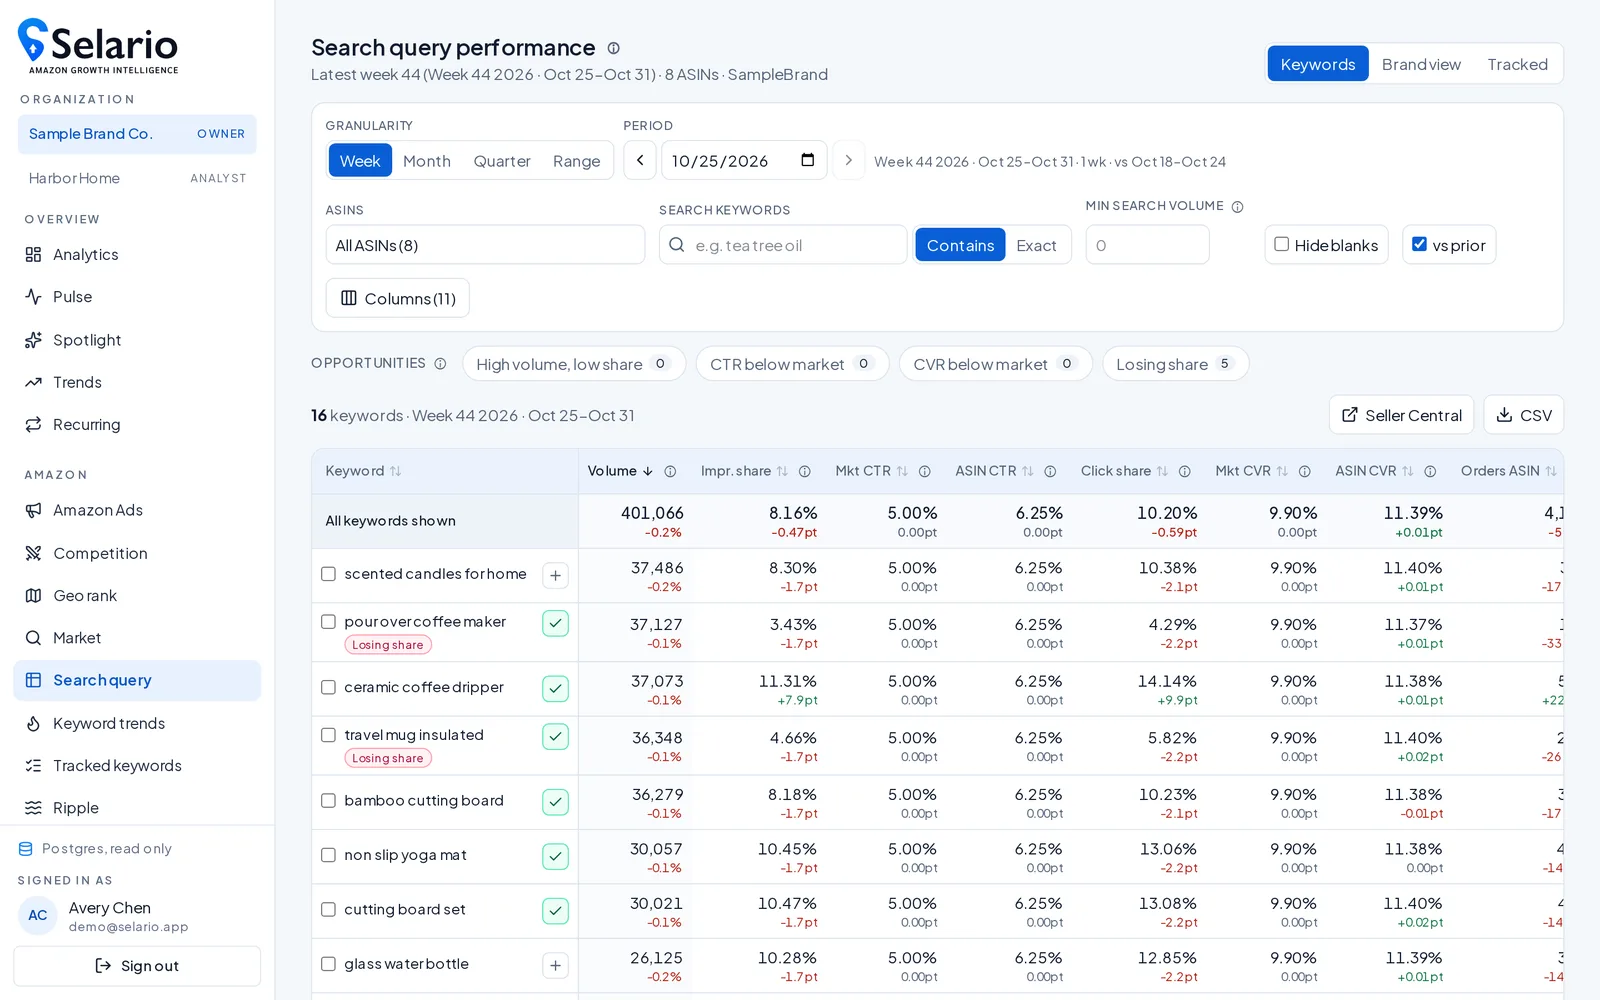
Search query performance
What shoppers search before they buy you.
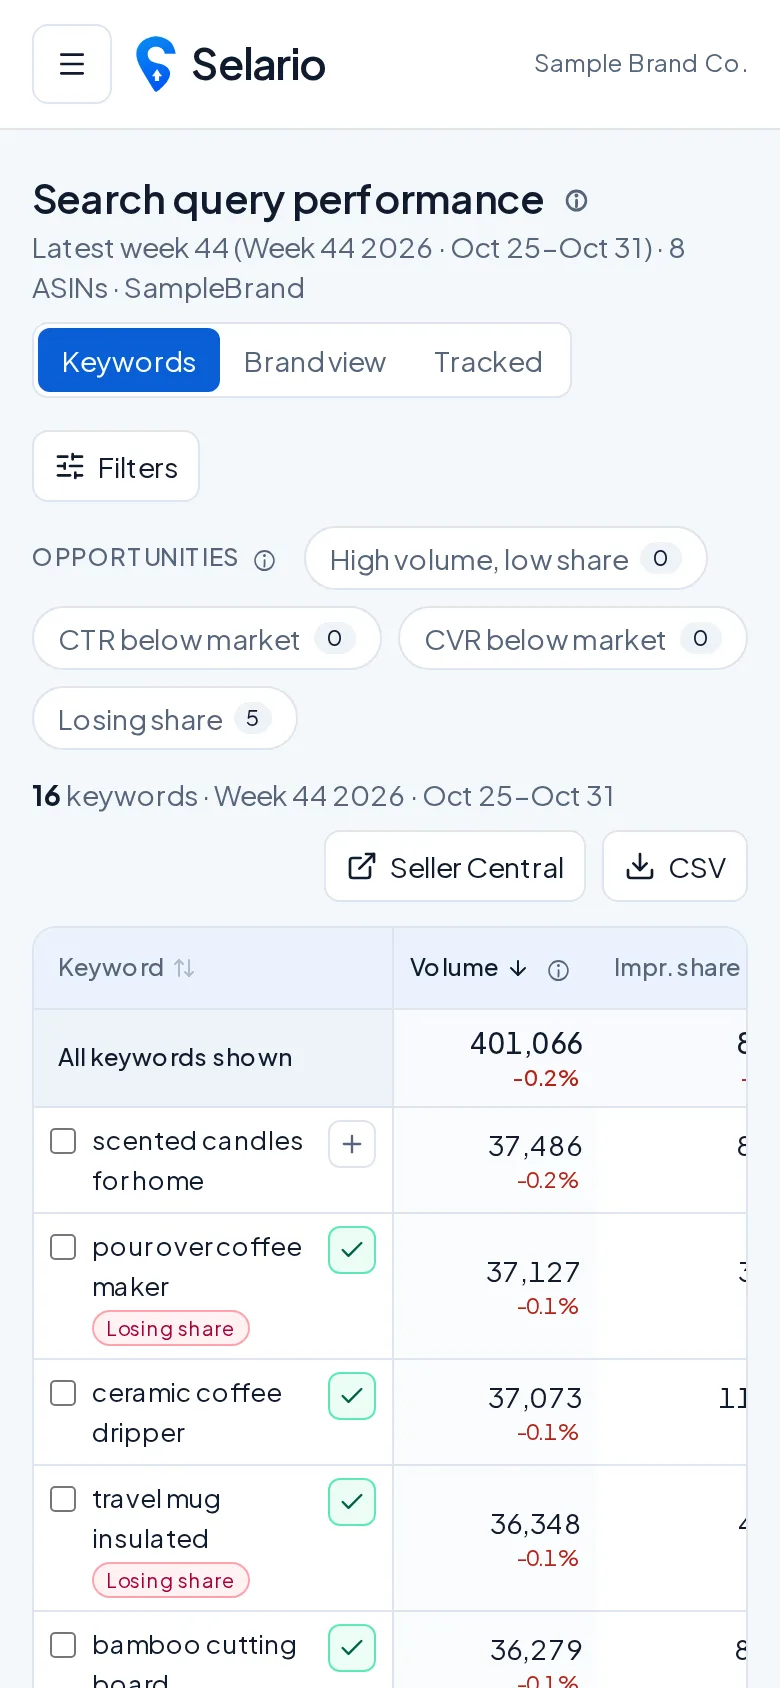
From Amazon Brand Analytics: every search query that led to your products, by week and ASIN — impressions, clicks, add-to-carts and purchases, your share versus the whole market, plus ready-made opportunity filters like “high volume, low share”.
How to use it
- Pick a week and an ASIN (or all).
- Use Opportunities chips to find quick wins.
- Switch to Brand view for brand-level share.
Amazon research
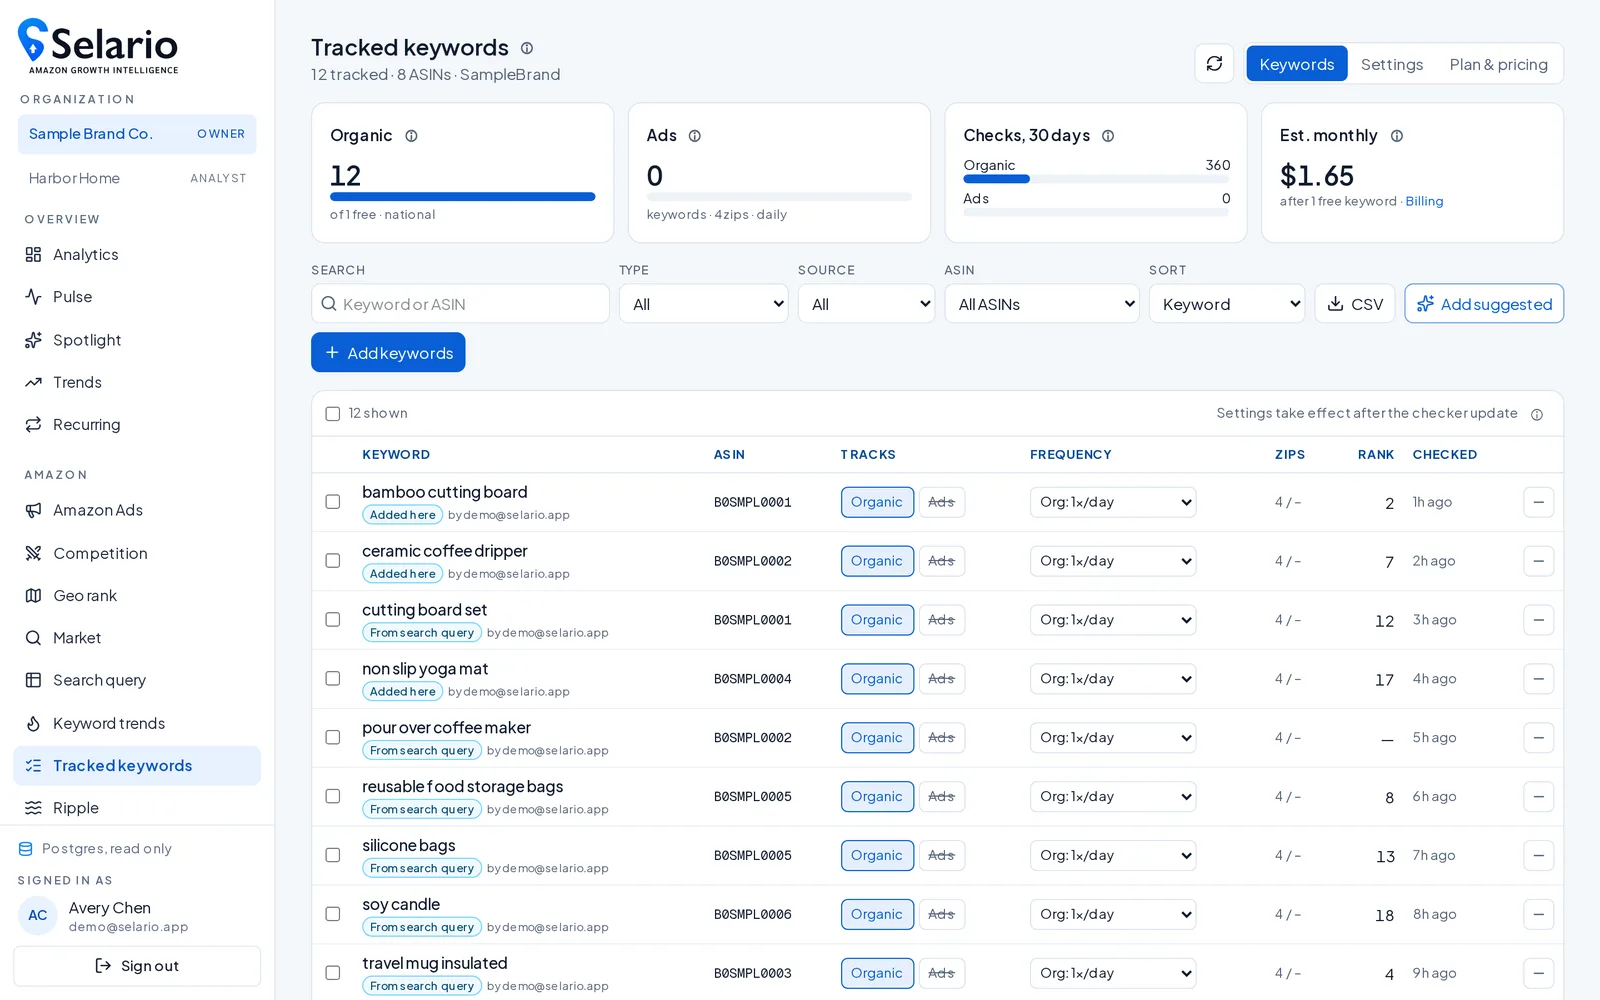
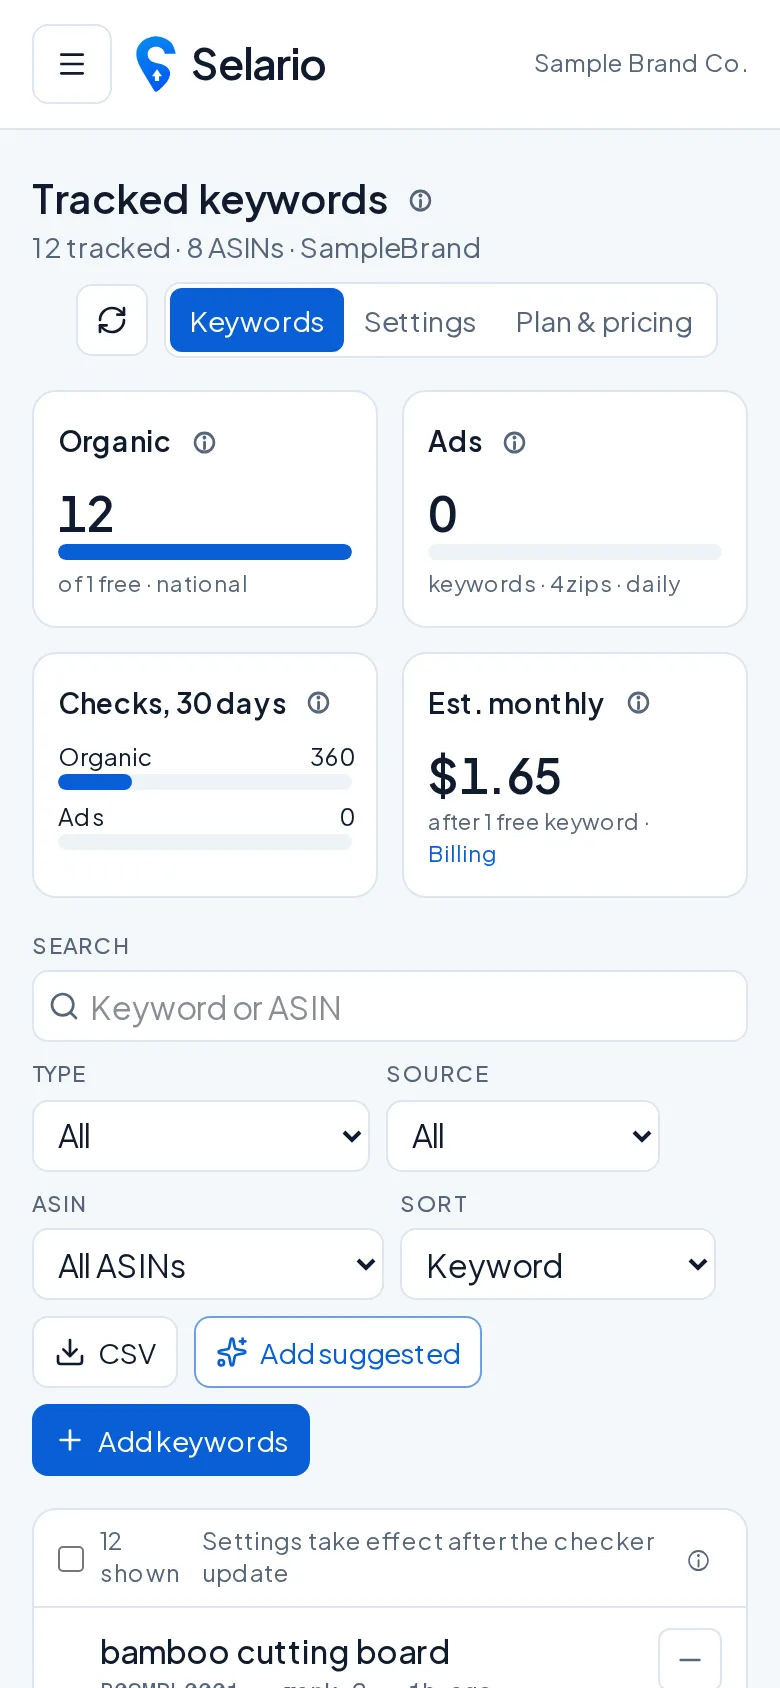
Tracked keywords
Your rank and ads, keyword by keyword.
Pick ASIN + keyword pairs and Selario checks where you rank organically and where your ads show, on a schedule and in the ZIP codes you choose. Each keyword now carries a category so you can filter large lists.
How to use it
- Click “+ Add keywords”, or “Add suggested” to start from your search-query data.
- Filter by category, type, source or ASIN.
- Export to CSV any time.
Amazon research
Keyword trends
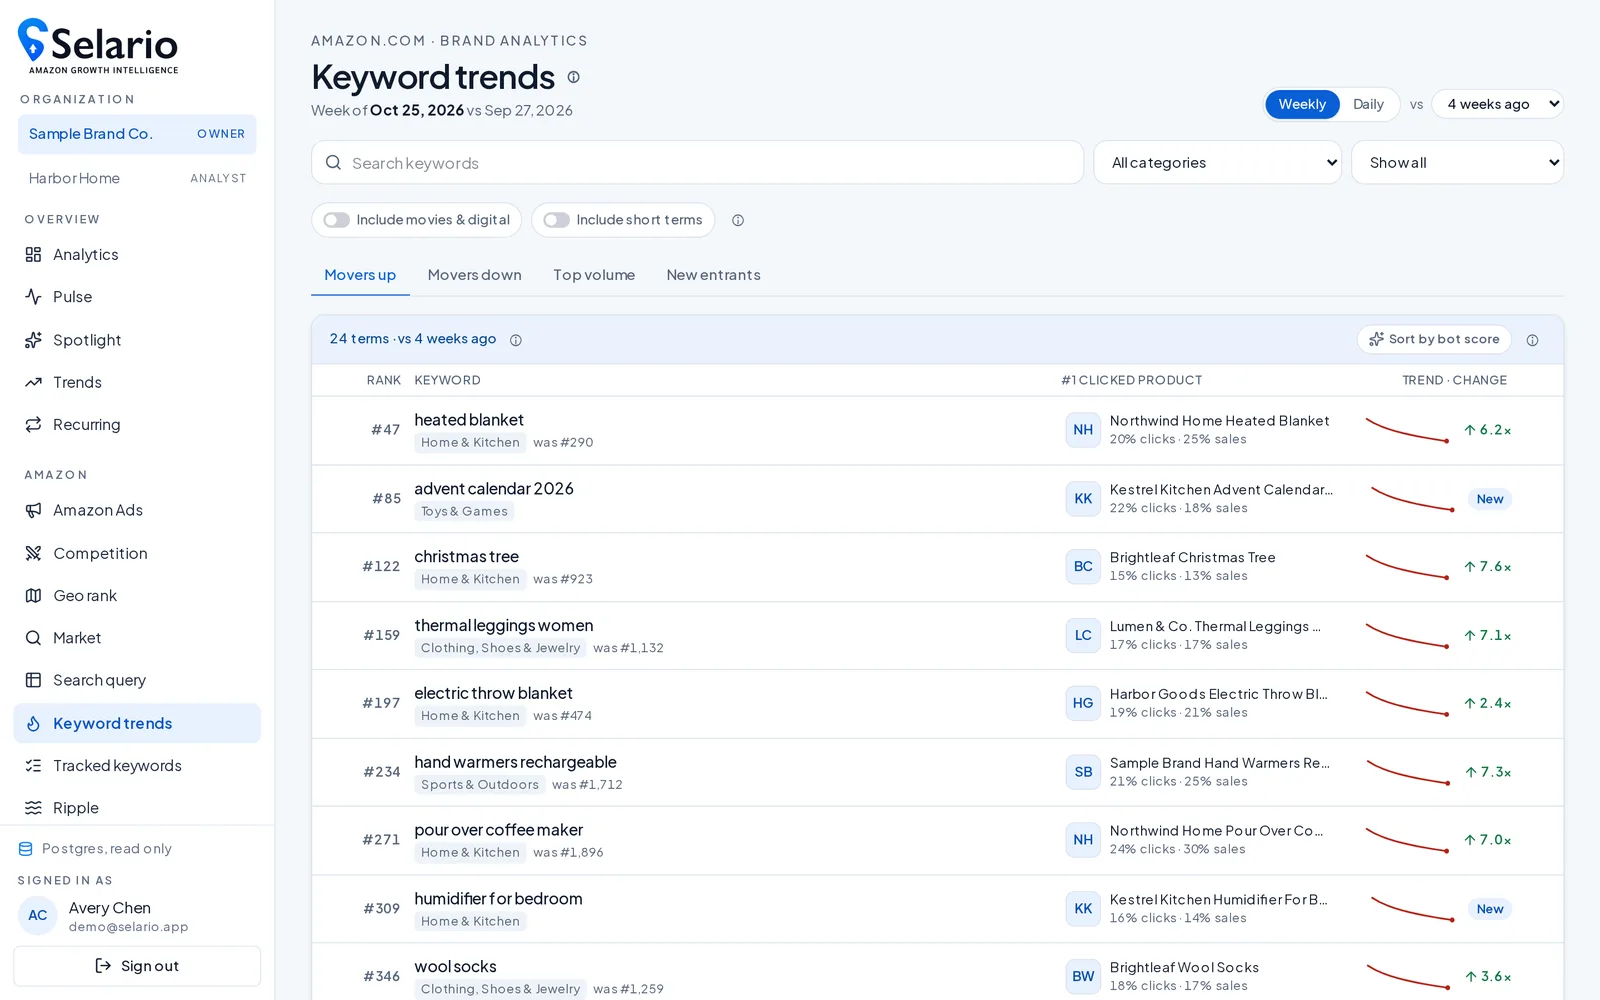
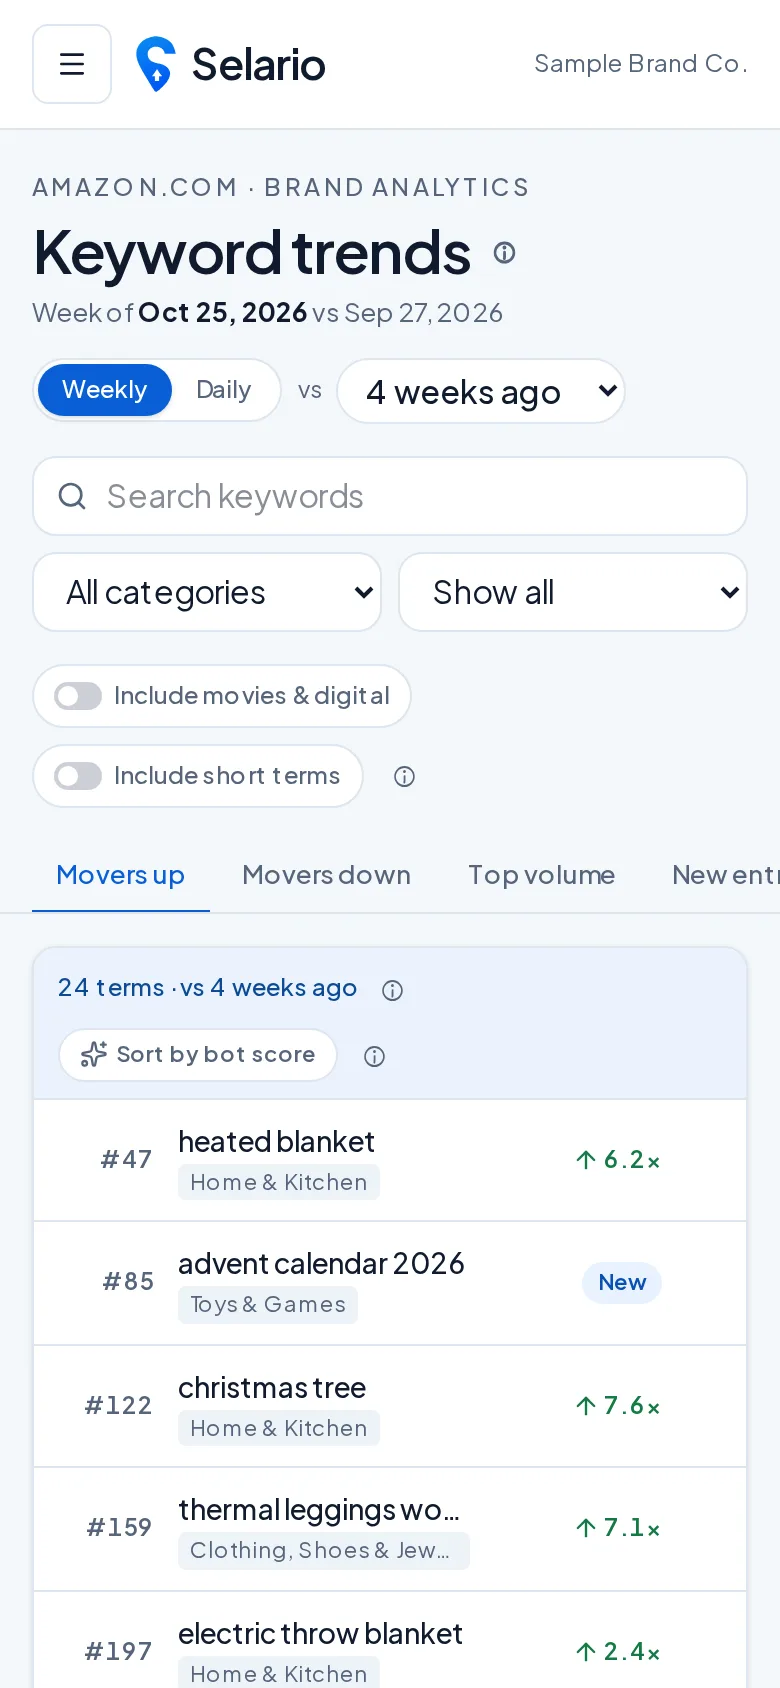
Every Amazon search term, ranked daily and weekly.
See the biggest movers up and down, top volume and brand-new search terms, with the top 3 clicked products for each — and flags for likely click-bot spikes. Every term has a category, so you can filter all search terms down to just your market. Two years of history are kept.
How to use it
- Choose Weekly or Daily and a comparison window.
- Filter by one or more categories (or Uncategorized).
- Tap a term to open its history and top clicked products.
TikTok + Amazon
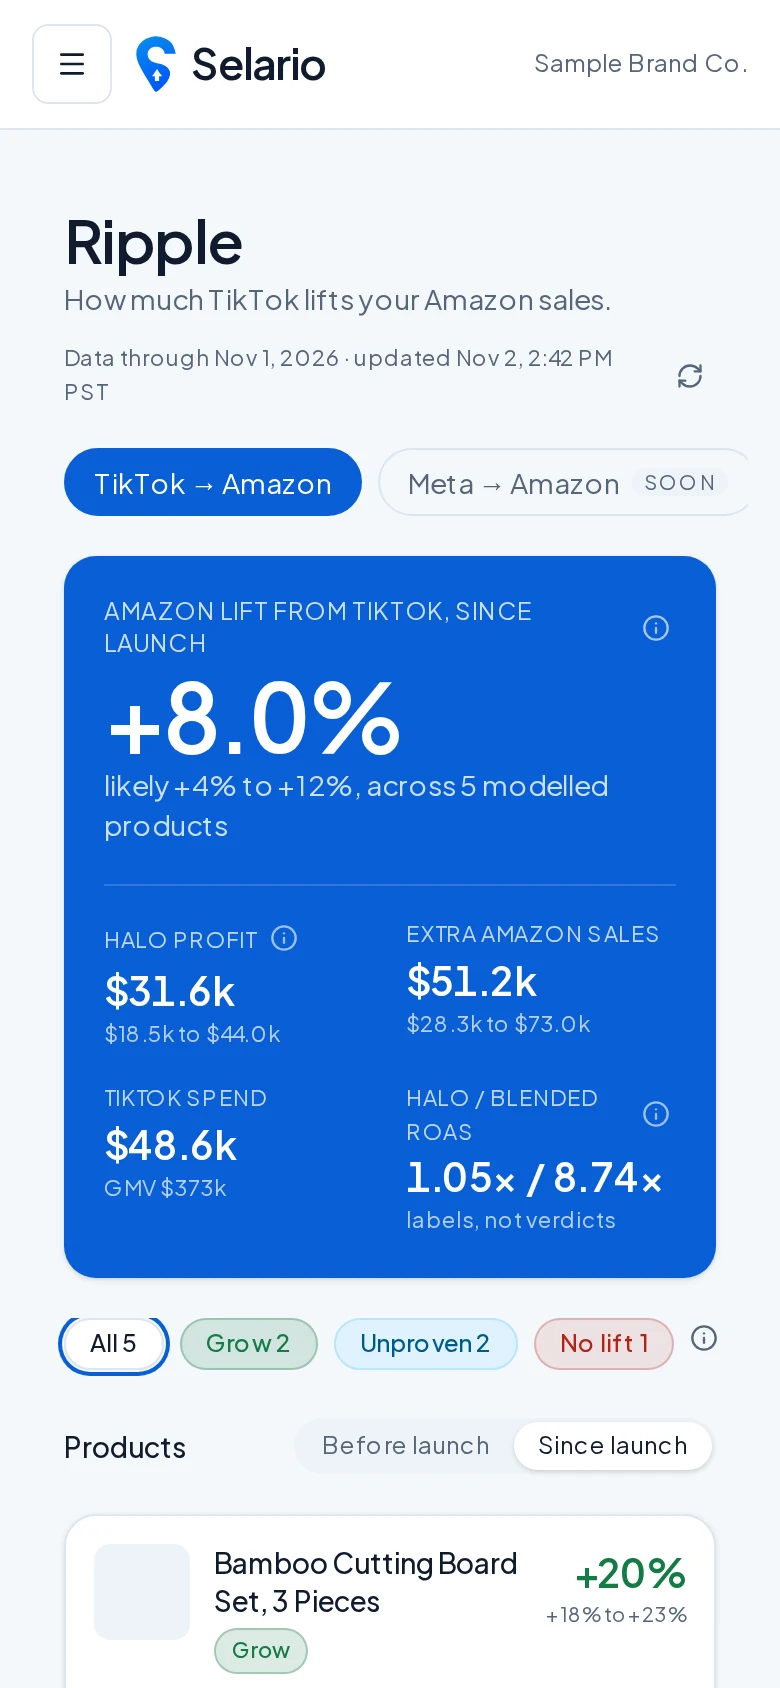
Ripple: TikTok halo on Amazon
How much TikTok lifts your Amazon sales.
Ripple measures the halo: extra Amazon units and profit that follow TikTok activity, with a verdict per product (lifting, fading, unproven) and a before-launch vs since-launch comparison.
How to use it
- Start with the headline lift and range.
- Open a product to see before vs since TikTok launch.
- Use the verdict chips to filter.
Setup
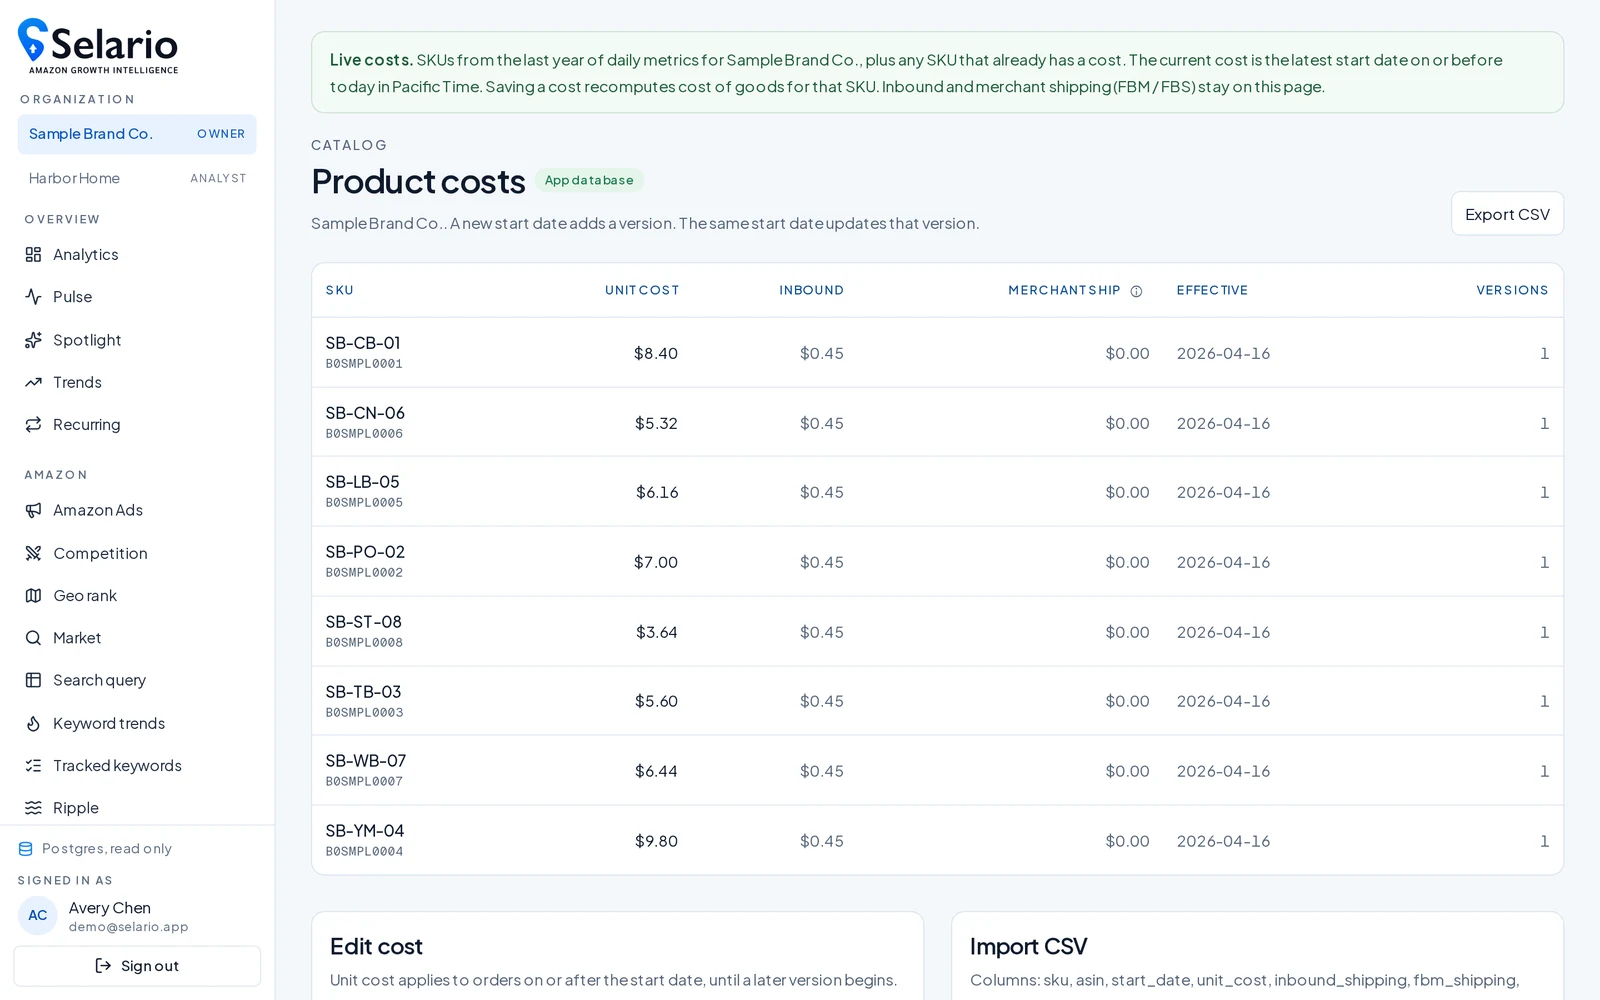
Product costs
Get real profit, not just revenue.
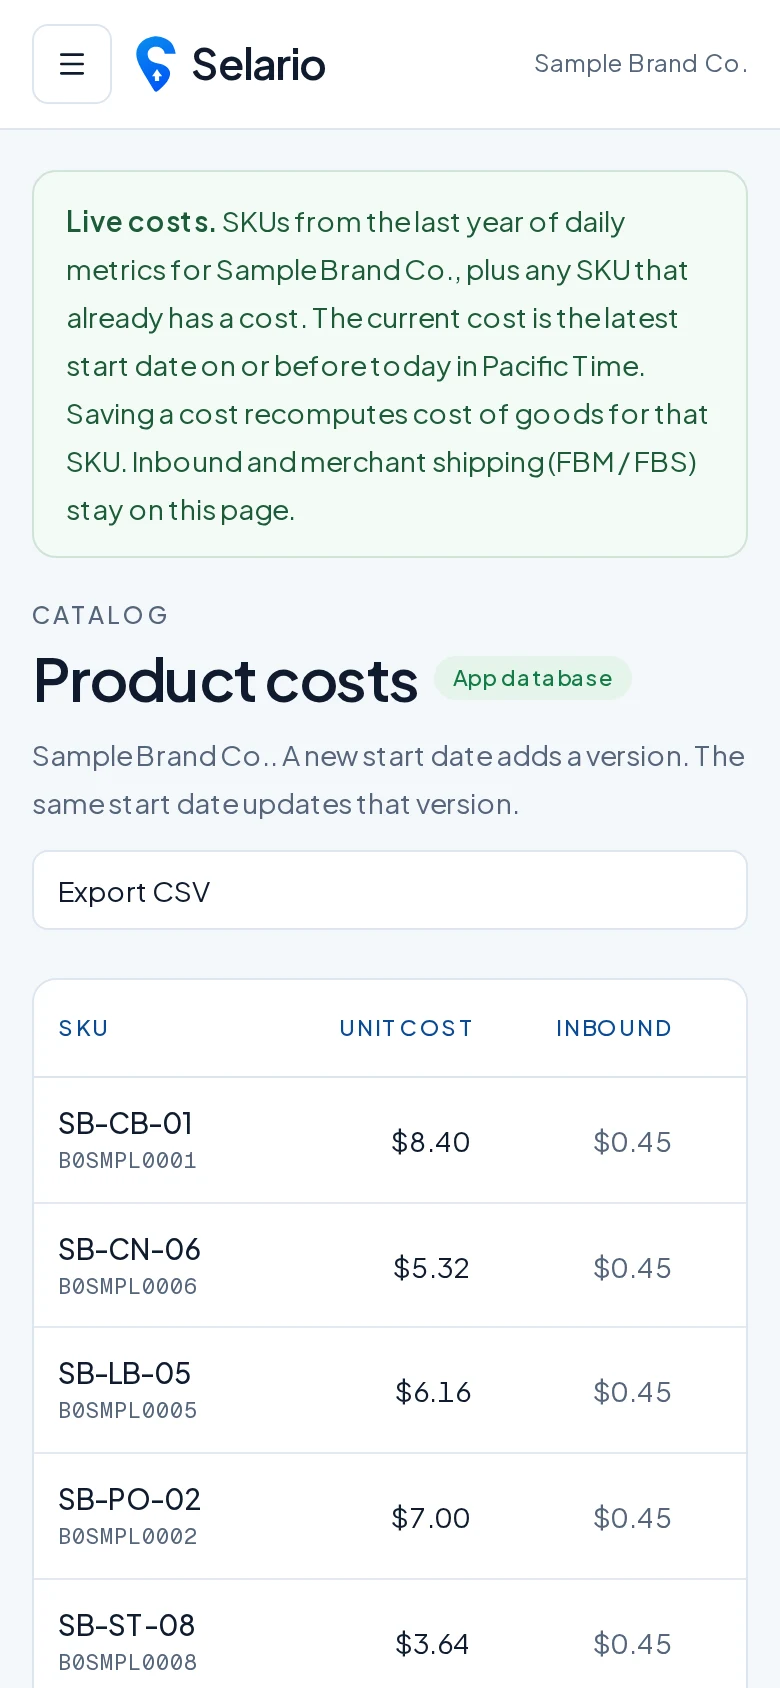
Enter landed cost per SKU, with start dates so price changes keep history accurate. Selario uses these everywhere net profit appears. Export to CSV for your accountant.
How to use it
- Add a cost per SKU (and a new dated row when it changes).
- Check “No cost” on the Dashboard to find gaps.
- Export CSV any time.
Setup
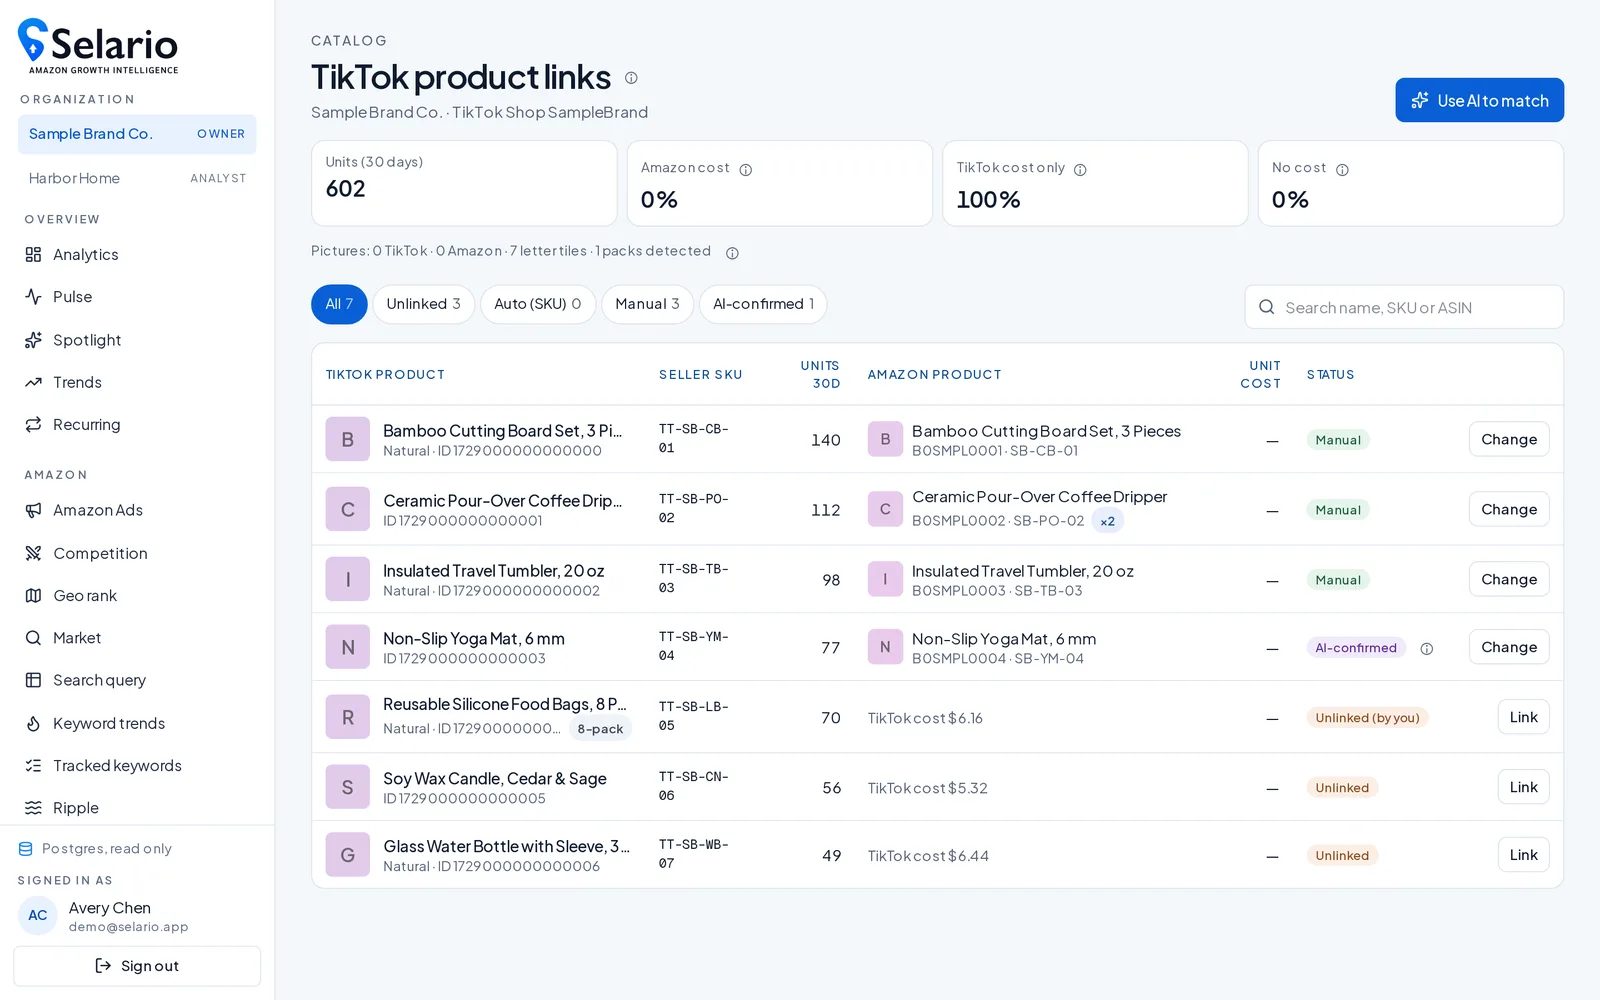
TikTok product links
Connect TikTok listings to Amazon products.
Match each TikTok Shop product to its Amazon SKU so stock, profit and Ripple line up. Use AI to match does most of it automatically; you confirm or change.
How to use it
- Click “Use AI to match”.
- Review Unlinked and Auto (AI) tabs.
- Change any match with one tap.
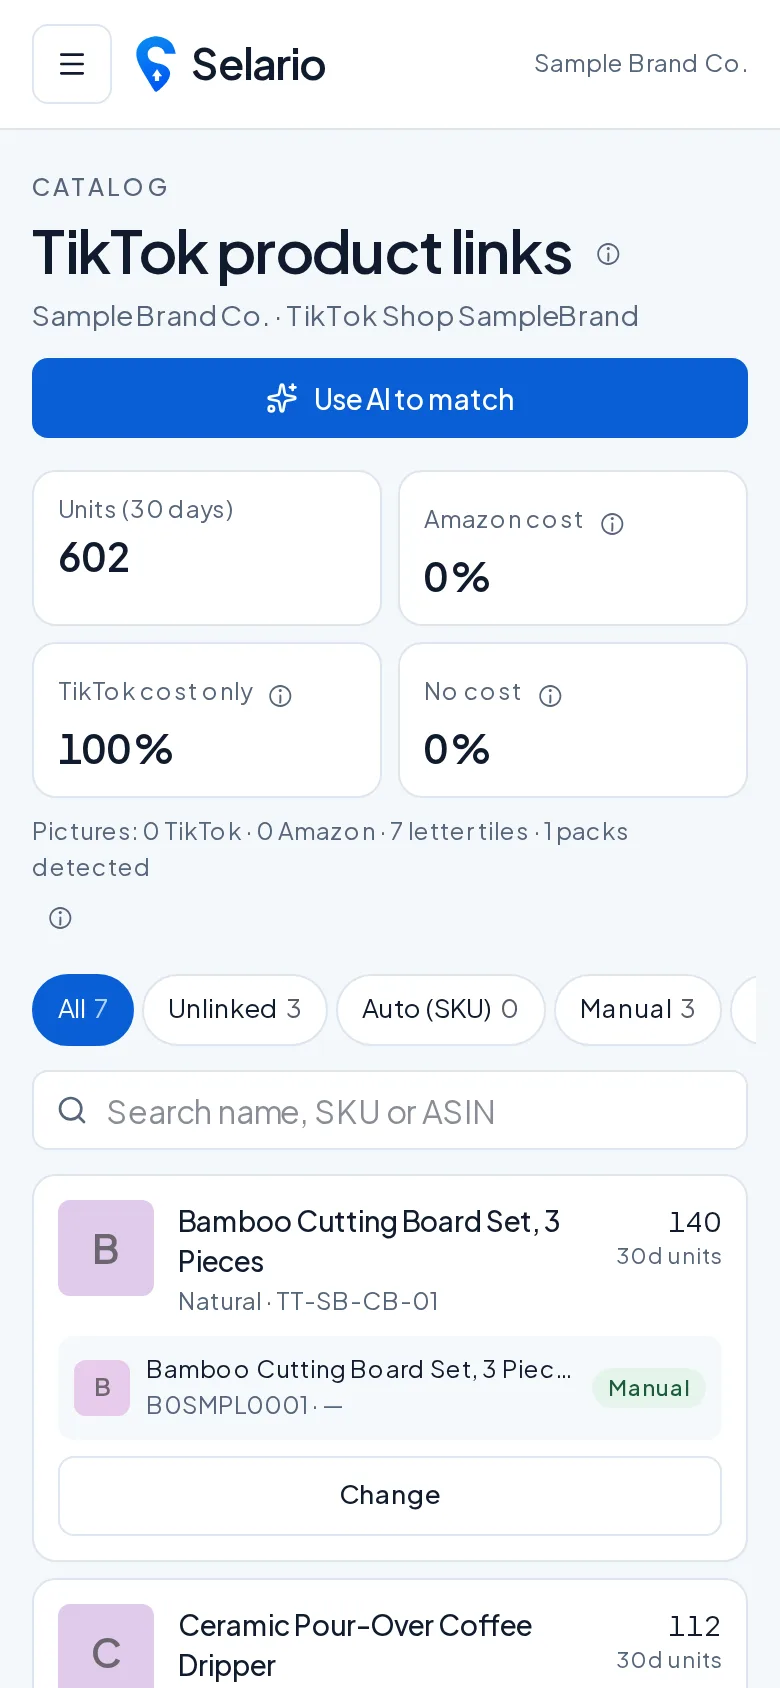
Setup
Settings & connections
Connect once, read-only.
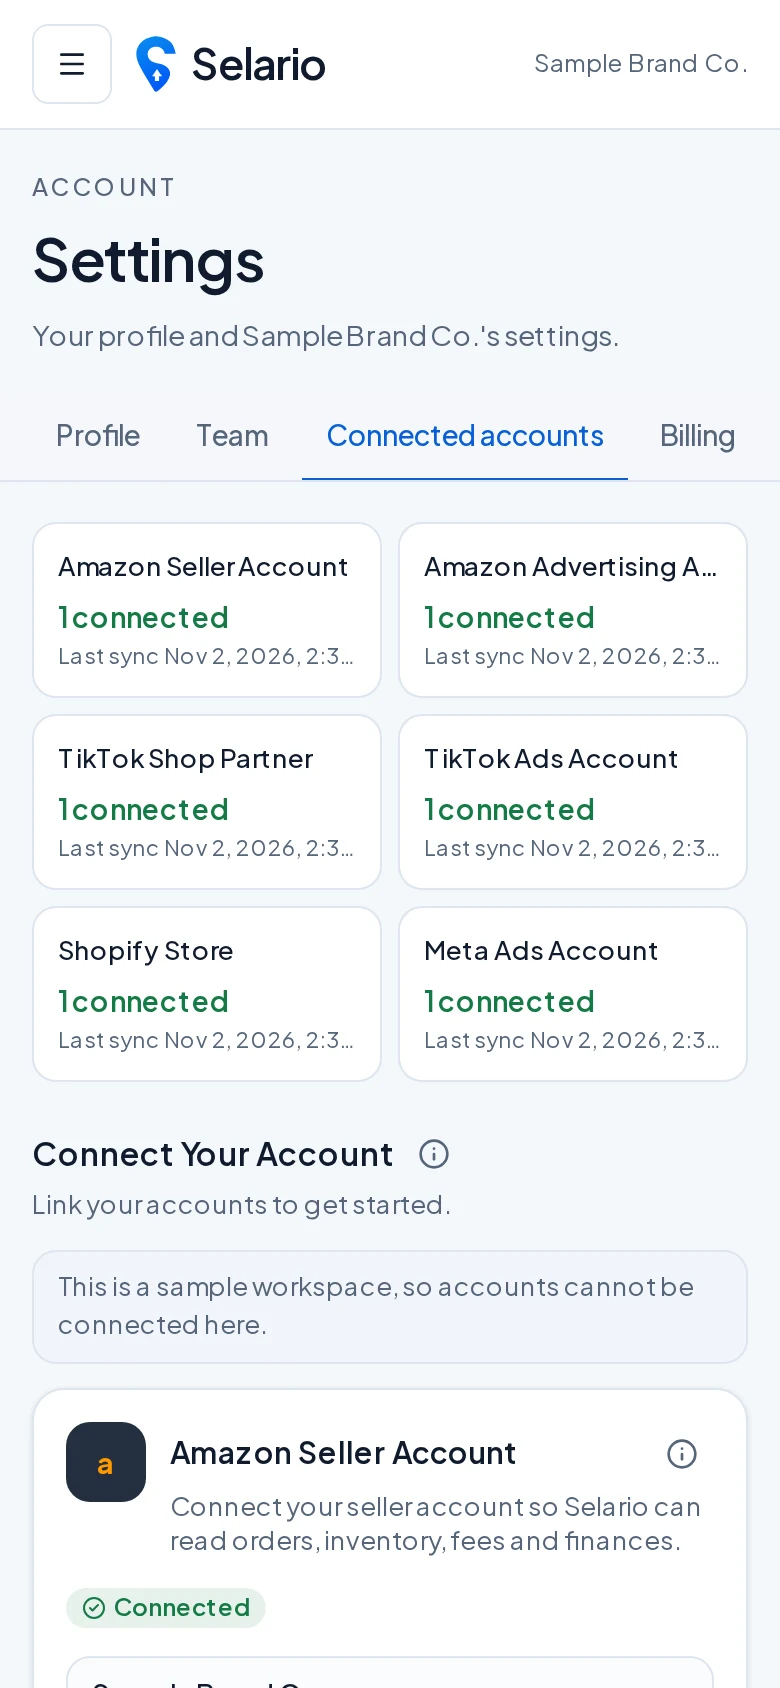
Connect Amazon Seller Central, Amazon Advertising, TikTok Shop and TikTok Ads. Invite your team with roles, and manage billing. Connections are read-only: Selario reads your data and never changes your listings, prices or ads.
How to use it
- Settings → Connected accounts → Connect.
- Settings → Team to invite people with a role.
- Settings → Billing for keyword tracking plans.
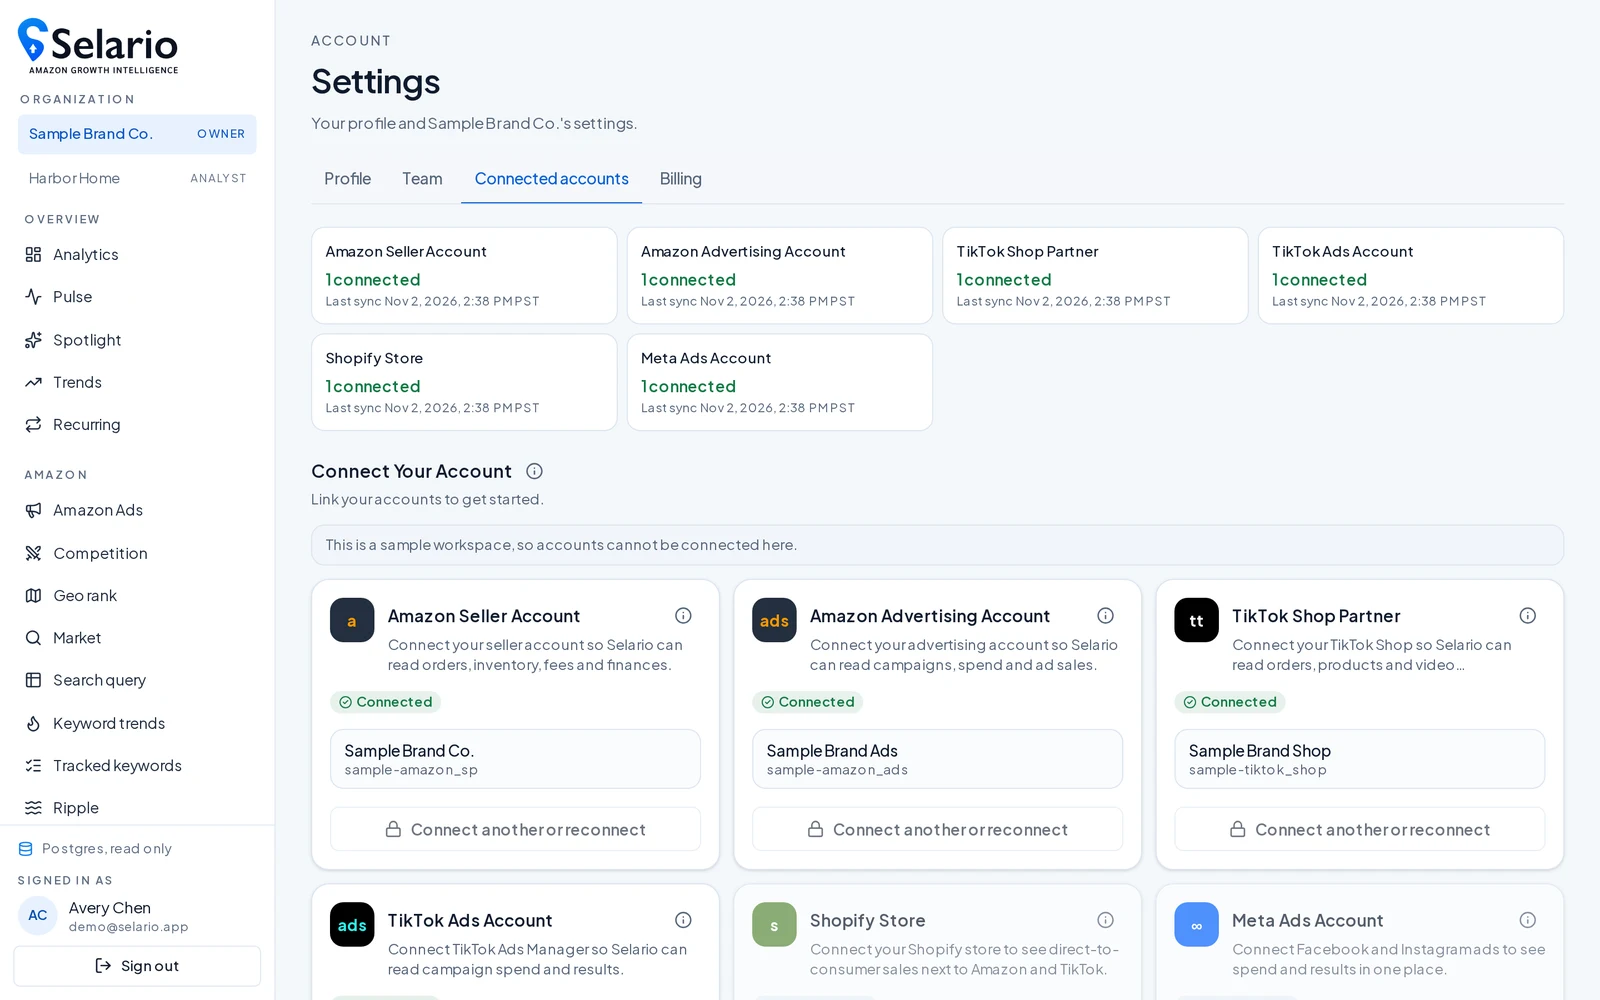
Integrations
Amazon Seller Central
Orders, sales, inventory, fees, Subscribe & Save and Brand Analytics.
Amazon Advertising
Sponsored Products spend and performance next to your sales.
TikTok Shop & TikTok Ads
Shop sales, stock and ads — plus Ripple to measure the Amazon halo.
Walmart SOON
Walmart Marketplace support is on the way.
AI chat (MCP) EARLY ACCESS
Ask ChatGPT, Claude and other AI tools about your own data — scoped to your account only.
iPhone app
Selario on your home screen
No App Store needed. Selario installs straight from Safari, opens full-screen and can send push notifications such as low-stock alerts.
- Open app.selario.com in Safari and sign in.
- Tap the Share button.
- Choose Add to Home Screen, then Add.
- Open Selario from your home screen and allow notifications.
Security & data isolation
Read-only connections
Selario only reads data from Amazon and TikTok. It never edits listings, prices, inventory or ads.
Your data stays yours
Every request is checked on the server against your organization, so no account can see another account’s data.
Secrets stay on the server
API keys and tokens are never sent to the browser or shown to signed-in users.
Roles for your team
Invite teammates with a role; sensitive figures like shipping costs are for owners and admins only.
Pricing: free to start
Free to start, no credit card required. Selario is free while in early access; pricing may change later and we’ll tell you before anything is charged.
Selario dashboards
Amazon and TikTok Shop dashboards, Ripple (TikTok halo), Recurring, SQP, keyword trends and the iPhone app. No credit card required.
Keyword rank tracking
Track your first keyword free, then from $0.15 per keyword per month. A card is only needed for more keywords, ZIP codes or ads tracking.
FAQ
Can I see Subscribe & Save subscribers vs organic orders?
Yes. Selario separates Subscribe & Save subscribers from organic and one-time buyers per product — data Amazon doesn’t provide to most API connections.
How do I measure TikTok's impact on Amazon sales?
Selario's Ripple dashboard compares each product's actual Amazon sales after TikTok activity with what it would likely have sold without it, and shows the extra units as a range. See TikTok halo.
What is the best free Helium 10 alternative for my own store's analytics?
Selario is free during early access and covers live Amazon sales and profit per ASIN, organic vs PPC, FBA inventory, SQP and keyword trends, plus TikTok Shop. See free alternatives.
How do I test my Amazon main image against competitors?
Use Selario’s Image Duel: real shoppers vote between your hero image and your top 3–5 organic competitors, with AI summaries and demographics, from $2 per vote. See Amazon main image testing.
Does TikTok increase Amazon sales?
Often, yes — but it varies by product. Selario’s Ripple dashboard estimates the extra Amazon sales and branded searches that follow TikTok Shop and creator activity, per product, with a range. See how we measure the TikTok halo.
Which marketplaces does Selario support?
Amazon (US) and TikTok Shop today. Walmart is coming soon.
Can Selario change my listings, prices or ads?
No. Connections are read-only. Selario reads your sales, orders, inventory, ads and Brand Analytics data and never writes back.
Can my team members see everything?
You invite people with a role. Sensitive areas such as shipping costs are limited to owners and admins.
How is my data kept separate from other sellers?
Every account’s data is isolated: each request is checked against the signed-in user’s organization on the server, so one account can never read another’s data. Secret keys stay on the server and are never sent to your browser.
Is Selario free?
Yes — Free to start, no credit card required. Selario is free while in early access. Keyword rank tracking includes one free keyword, then from $0.15 per keyword per month. Pricing may change later, and we’ll tell you first.
Is there a phone app?
Yes. Open Selario in Safari on your iPhone, tap Share → Add to Home Screen. It opens full-screen like an app and can send low-stock push notifications.
Will I be able to chat with my data using AI?
Yes. Selario’s MCP connector lets ChatGPT, Claude and other AI apps answer questions about your own account’s data only, read-only. It’s rolling out in early access — see AI chat with your Amazon data.
How long is history kept?
Keyword trends keep two years of search-term history. Your store metrics history depends on what Amazon and TikTok provide when you connect.